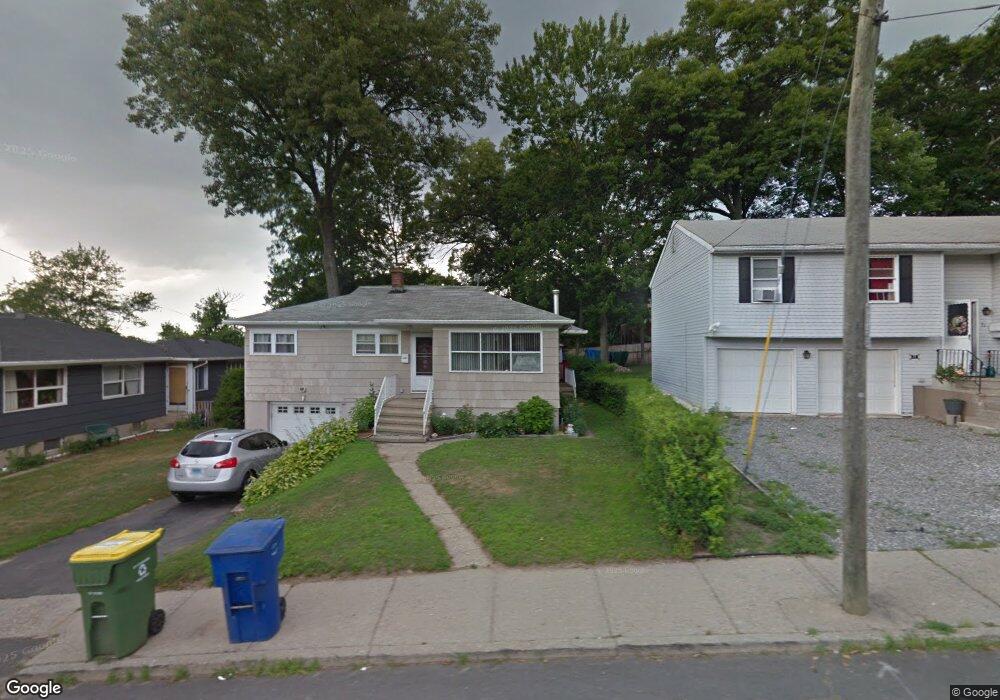
63 Moran St Waterbury, CT 06704
North End District NeighborhoodEstimated Value: $248,000 - $280,000
3
Beds
2
Baths
1,120
Sq Ft
$235/Sq Ft
Est. Value
About This Home
This home is located at 63 Moran St, Waterbury, CT 06704 and is currently estimated at $263,744, approximately $235 per square foot. 63 Moran St is a home located in New Haven County with nearby schools including F. J. Kingsbury School, North End Middle School, and Wilby High School.
Ownership History
Date
Name
Owned For
Owner Type
Purchase Details
Closed on
Jul 24, 1996
Sold by
Estrada Carmen V and Estrada Iasias
Bought by
Vargas Jorge L and Vargas Daien
Current Estimated Value
Purchase Details
Closed on
Aug 24, 1994
Sold by
Fried Louis and Ressler Ida
Bought by
Estrada Carmen and Estrada Iasias
Create a Home Valuation Report for This Property
The Home Valuation Report is an in-depth analysis detailing your home's value as well as a comparison with similar homes in the area
Home Values in the Area
Average Home Value in this Area
Purchase History
| Date | Buyer | Sale Price | Title Company |
|---|---|---|---|
| Vargas Jorge L | $64,300 | -- | |
| Estrada Carmen | $32,750 | -- | |
| Estrada Carmen | $32,750 | -- |
Source: Public Records
Mortgage History
| Date | Status | Borrower | Loan Amount |
|---|---|---|---|
| Open | Estrada Carmen | $9,813 | |
| Closed | Estrada Carmen | $9,813 | |
| Open | Estrada Carmen | $124,875 |
Source: Public Records
Tax History
| Year | Tax Paid | Tax Assessment Tax Assessment Total Assessment is a certain percentage of the fair market value that is determined by local assessors to be the total taxable value of land and additions on the property. | Land | Improvement |
|---|---|---|---|---|
| 2025 | $4,906 | $109,060 | $19,810 | $89,250 |
| 2024 | $5,392 | $109,060 | $19,810 | $89,250 |
| 2023 | $5,910 | $109,060 | $19,810 | $89,250 |
| 2022 | $3,833 | $63,660 | $19,840 | $43,820 |
| 2021 | $3,833 | $63,660 | $19,840 | $43,820 |
| 2020 | $3,833 | $63,660 | $19,840 | $43,820 |
| 2019 | $3,833 | $63,660 | $19,840 | $43,820 |
| 2018 | $3,833 | $63,660 | $19,840 | $43,820 |
| 2017 | $4,089 | $67,920 | $19,840 | $48,080 |
| 2016 | $4,089 | $67,920 | $19,840 | $48,080 |
| 2015 | $3,954 | $67,920 | $19,840 | $48,080 |
| 2014 | $3,954 | $67,920 | $19,840 | $48,080 |
Source: Public Records
Map
Nearby Homes
- 40 Robert St
- 40 Houston St
- 227 Fanning St
- 124 Williamson Dr
- 905 Cooke St
- 61 Nottingham Terrace
- 0 Lonsdale St
- 578 Columbia Boulevard Extension
- 577 Columbia Boulevard Extension
- 265 Citizens Ave
- 257 Cooke St
- 1054 Cooke St
- 54 Woodstock St
- 0 Farmwood Rd
- 484 Waterville St
- 37 Byrneside Ave
- 0 Hauser St Unit 24155063
- 31 Farmwood Rd
- 68 Valentino Dr
- 121 Hillview Ave
Your Personal Tour Guide
Ask me questions while you tour the home.