63 Oldham Rd Osterville, MA 02655
Osterville NeighborhoodEstimated Value: $602,354 - $744,000
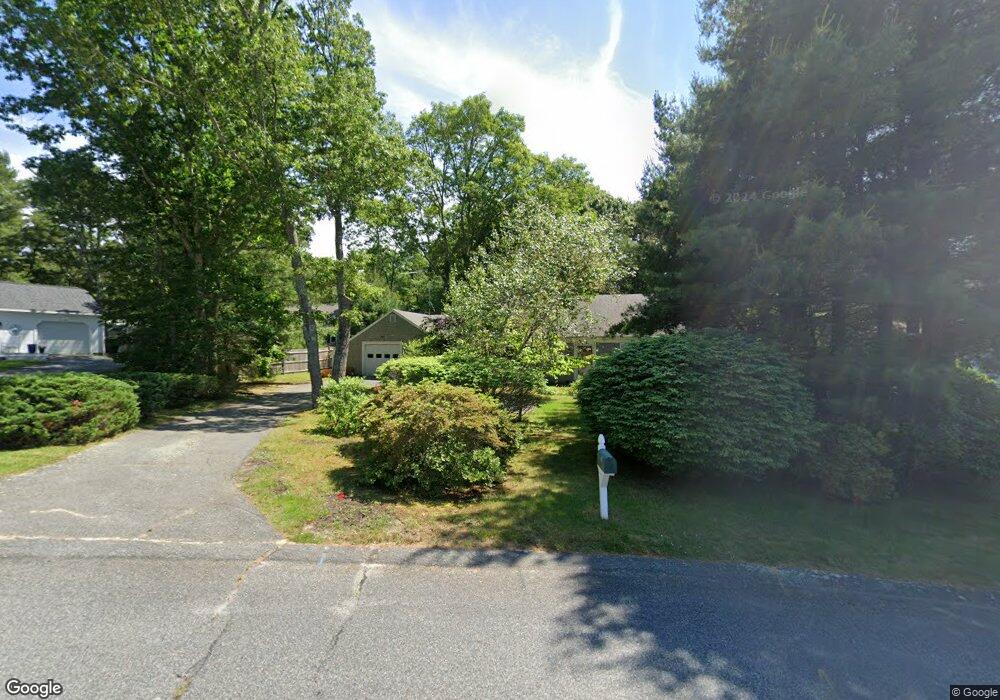
About This Home
This home is located at 63 Oldham Rd, Osterville, MA 02655 and is currently estimated at $683,089, approximately $682 per square foot. 63 Oldham Rd is a home located in Barnstable County with nearby schools including West Villages Elementary School, Barnstable United Elementary School, and Barnstable Intermediate School.
Ownership History
We collect this data history from publicly available records. To have your information removed, we recommend requesting removal directly through your county’s website.
Purchase Details
Purchase Details
Home Financials for this Owner
Home Financials are based on the most recent Mortgage that was taken out on this home.Home Values in the Area
Average Home Value in this Area
Purchase History
We collect this data history from publicly available records. To have your information removed, we recommend requesting removal directly through your county’s website.
| Date | Buyer | Sale Price | Title Company |
|---|---|---|---|
| -- | -- | ||
| $110,000 | -- |
Mortgage History
We collect this data history from publicly available records. To have your information removed, we recommend requesting removal directly through your county’s website.
| Date | Status | Borrower | Loan Amount |
|---|---|---|---|
| Previous Owner | $98,890 |
Tax History
We collect this data history from publicly available records. To have your information removed, we recommend requesting removal directly through your county’s website.
| Year | Tax Paid | Tax Assessment Tax Assessment Total Assessment is a certain percentage of the fair market value that is determined by local assessors to be the total taxable value of land and additions on the property. | Land | Improvement |
|---|---|---|---|---|
| 2025 | $4,148 | $512,700 | $153,200 | $359,500 |
| 2024 | $3,942 | $504,800 | $153,200 | $351,600 |
| 2023 | $3,703 | $444,000 | $139,300 | $304,700 |
| 2022 | $3,514 | $364,500 | $103,200 | $261,300 |
| 2021 | $3,313 | $315,800 | $103,200 | $212,600 |
| 2020 | $3,403 | $310,500 | $103,200 | $207,300 |
| 2019 | $3,222 | $285,600 | $103,200 | $182,400 |
| 2018 | $2,933 | $261,400 | $108,600 | $152,800 |
| 2017 | $2,708 | $251,700 | $108,600 | $143,100 |
| 2016 | $2,753 | $252,600 | $109,500 | $143,100 |
| 2015 | $2,618 | $241,300 | $106,400 | $134,900 |
Map
- 31 Falling Leaf Ln
- 51 Falling Leaf Ln
- 103 Falling Leaf Ln
- 31 Jasons Ln
- 7 Bonnie Briar Rd
- 5 Briar Patch Rd
- 153 Hickory Hill Cir
- 81 Osterville West Barnstable Rd
- 114 King Arthur Dr
- 114 King Arthur Dr
- 34 Farm Valley Rd
- 40 Waterfield Rd
- 55 Seth Goodspeed Way
- 8 Brigantine Ave
- 441 Old Mill Rd
- 140 Seapuit Rd
- 351 Swift Ave
- 280 Ice Valley Rd
- 420 Starboard Ln
- 84 Hinckley Cir
Ask me questions while you tour the home.