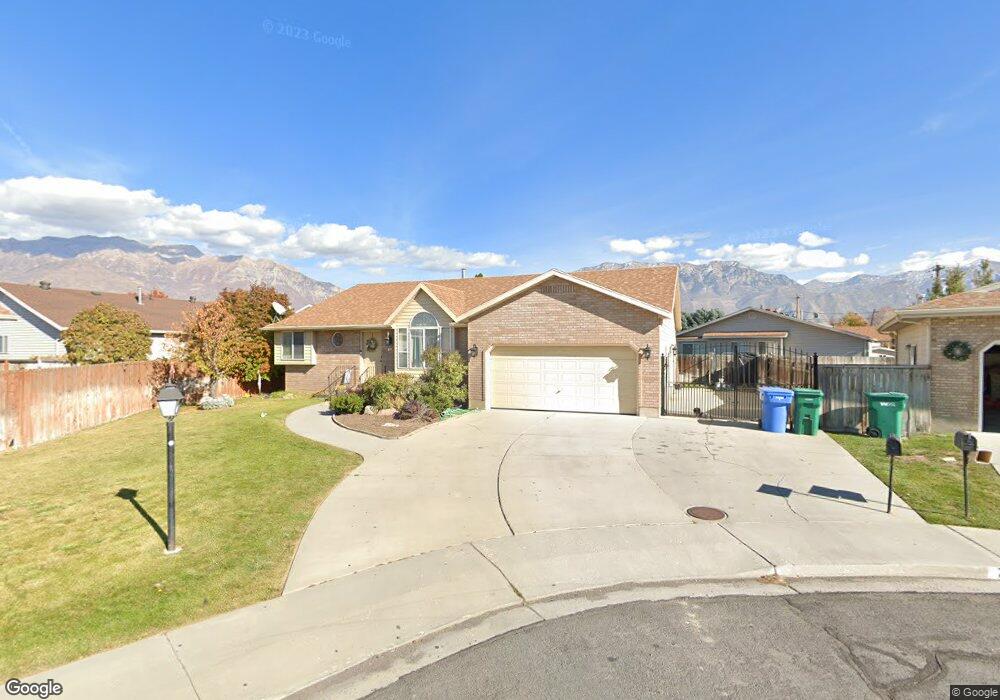
63 S 875 W Orem, UT 84058
Orem Park NeighborhoodEstimated Value: $547,000 - $601,000
5
Beds
3
Baths
2,585
Sq Ft
$220/Sq Ft
Est. Value
About This Home
This home is located at 63 S 875 W, Orem, UT 84058 and is currently estimated at $568,782, approximately $220 per square foot. 63 S 875 W is a home located in Utah County with nearby schools including Orem Elementary School, Orem Junior High School, and Mountain View High School.
Ownership History
Date
Name
Owned For
Owner Type
Purchase Details
Closed on
Apr 7, 2021
Sold by
Oropeza Rocio D and Oropeza Erika
Bought by
Oropeza Rocio D
Current Estimated Value
Home Financials for this Owner
Home Financials are based on the most recent Mortgage that was taken out on this home.
Original Mortgage
$281,847
Outstanding Balance
$254,474
Interest Rate
3%
Mortgage Type
FHA
Estimated Equity
$314,308
Purchase Details
Closed on
Jun 26, 2017
Sold by
Gallagher Joan Greer and Joan Greer Gallagher Family Tr
Bought by
Oropeza Rocio D and Oropeza Erika
Home Financials for this Owner
Home Financials are based on the most recent Mortgage that was taken out on this home.
Original Mortgage
$270,019
Interest Rate
5.5%
Mortgage Type
FHA
Create a Home Valuation Report for This Property
The Home Valuation Report is an in-depth analysis detailing your home's value as well as a comparison with similar homes in the area
Home Values in the Area
Average Home Value in this Area
Purchase History
| Date | Buyer | Sale Price | Title Company |
|---|---|---|---|
| Oropeza Rocio D | -- | First Amer Orem Ctr Street | |
| Oropeza Rocio D | -- | Cottonwood Title |
Source: Public Records
Mortgage History
| Date | Status | Borrower | Loan Amount |
|---|---|---|---|
| Open | Oropeza Rocio D | $281,847 | |
| Closed | Oropeza Rocio D | $270,019 |
Source: Public Records
Tax History
| Year | Tax Paid | Tax Assessment Tax Assessment Total Assessment is a certain percentage of the fair market value that is determined by local assessors to be the total taxable value of land and additions on the property. | Land | Improvement |
|---|---|---|---|---|
| 2025 | $2,203 | $297,055 | -- | -- |
| 2024 | $2,203 | $269,335 | $0 | $0 |
| 2023 | $2,058 | $270,490 | $0 | $0 |
| 2022 | $1,991 | $253,440 | $0 | $0 |
| 2021 | $1,854 | $357,500 | $160,000 | $197,500 |
| 2020 | $1,697 | $321,600 | $128,000 | $193,600 |
| 2019 | $1,557 | $306,900 | $118,100 | $188,800 |
| 2018 | $1,540 | $290,000 | $101,700 | $188,300 |
| 2017 | $1,237 | $124,795 | $0 | $0 |
| 2016 | $1,296 | $120,560 | $0 | $0 |
| 2015 | $1,256 | $110,495 | $0 | $0 |
| 2014 | -- | $101,035 | $0 | $0 |
Source: Public Records
Map
Nearby Homes
- 896 W 30 S
- 45 N 970 W
- 237 S Ridgeview Dr
- 155 S 1200 W Unit 69
- 155 S 1200 W Unit 6
- 155 S 1200 W Unit 97
- 565 W 40 N
- 935 W 360 S
- 365 S 1015 W
- 508 W 40 N
- 278 S 1160 W
- 1225 W 160 N
- 222 N 1200 W Unit 144
- 222 N 1200 W Unit 53
- 222 N 1200 W Unit 84
- 506 S 800 West St Unit 13
- 148 S 400 W
- 162 N 450 W Unit 2
- 520 S 800 W Unit 14
- 350 S 1200 W Unit 2
Your Personal Tour Guide
Ask me questions while you tour the home.