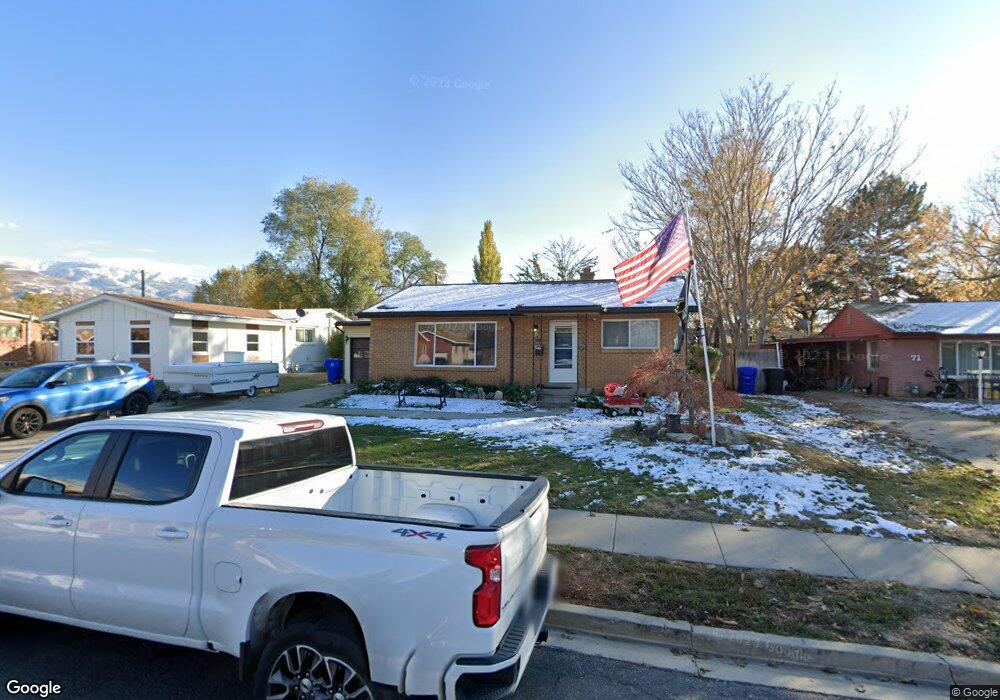
63 W 800 N Bountiful, UT 84010
Estimated Value: $477,000 - $532,000
3
Beds
2
Baths
2,016
Sq Ft
$250/Sq Ft
Est. Value
About This Home
This home is located at 63 W 800 N, Bountiful, UT 84010 and is currently estimated at $503,539, approximately $249 per square foot. 63 W 800 N is a home located in Davis County with nearby schools including Meadowbrook Elementary School, Bountiful Junior High School, and Viewmont High School.
Ownership History
Date
Name
Owned For
Owner Type
Purchase Details
Closed on
Apr 25, 2007
Sold by
Sullenger Brian E and Sullenger Elizabeth G
Bought by
Lauenroth Michael H and Lauenroth Patricia E
Current Estimated Value
Home Financials for this Owner
Home Financials are based on the most recent Mortgage that was taken out on this home.
Original Mortgage
$20,990
Interest Rate
6.11%
Mortgage Type
Credit Line Revolving
Purchase Details
Closed on
Jul 9, 1996
Sold by
The June M Westbrook Family Trust and Westbrook June M
Bought by
Sullenger Brian E and Sullenger Elizabeth G
Home Financials for this Owner
Home Financials are based on the most recent Mortgage that was taken out on this home.
Original Mortgage
$116,000
Interest Rate
8.03%
Create a Home Valuation Report for This Property
The Home Valuation Report is an in-depth analysis detailing your home's value as well as a comparison with similar homes in the area
Purchase History
We collect this data history from publicly available records. To have your information removed, we recommend requesting removal directly through your county’s website.
| Date | Buyer | Sale Price | Title Company |
|---|---|---|---|
| Lauenroth Michael H | -- | First American Title | |
| Sullenger Brian E | -- | Associated Title Company |
Source: Public Records
Mortgage History
We collect this data history from publicly available records. To have your information removed, we recommend requesting removal directly through your county’s website.
| Date | Status | Borrower | Loan Amount |
|---|---|---|---|
| Closed | Lauenroth Michael H | $20,990 | |
| Open | Lauenroth Michael H | $167,920 | |
| Previous Owner | Sullenger Brian E | $116,000 |
Source: Public Records
Tax History
| Year | Tax Paid | Tax Assessment Tax Assessment Total Assessment is a certain percentage of the fair market value that is determined by local assessors to be the total taxable value of land and additions on the property. | Land | Improvement |
|---|---|---|---|---|
| 2025 | $3,118 | $247,500 | $130,105 | $117,395 |
| 2024 | $2,697 | $239,800 | $115,606 | $124,194 |
| 2023 | $2,735 | $418,000 | $213,328 | $204,672 |
| 2022 | $2,855 | $239,801 | $116,661 | $123,140 |
| 2021 | $2,480 | $343,000 | $152,650 | $190,350 |
| 2020 | $2,041 | $279,000 | $130,519 | $148,481 |
| 2019 | $2,163 | $278,000 | $139,119 | $138,881 |
| 2018 | $1,950 | $252,000 | $136,369 | $115,631 |
| 2016 | $1,722 | $115,995 | $56,584 | $59,411 |
| 2015 | $1,589 | $107,195 | $56,584 | $50,611 |
| 2014 | $1,573 | $113,565 | $56,584 | $56,981 |
| 2013 | -- | $100,689 | $36,190 | $64,499 |
Source: Public Records
Map
Nearby Homes
Your Personal Tour Guide
Ask me questions while you tour the home.