Estimated Value: $124,000 - $191,475
3
Beds
2
Baths
1,972
Sq Ft
$77/Sq Ft
Est. Value
About This Home
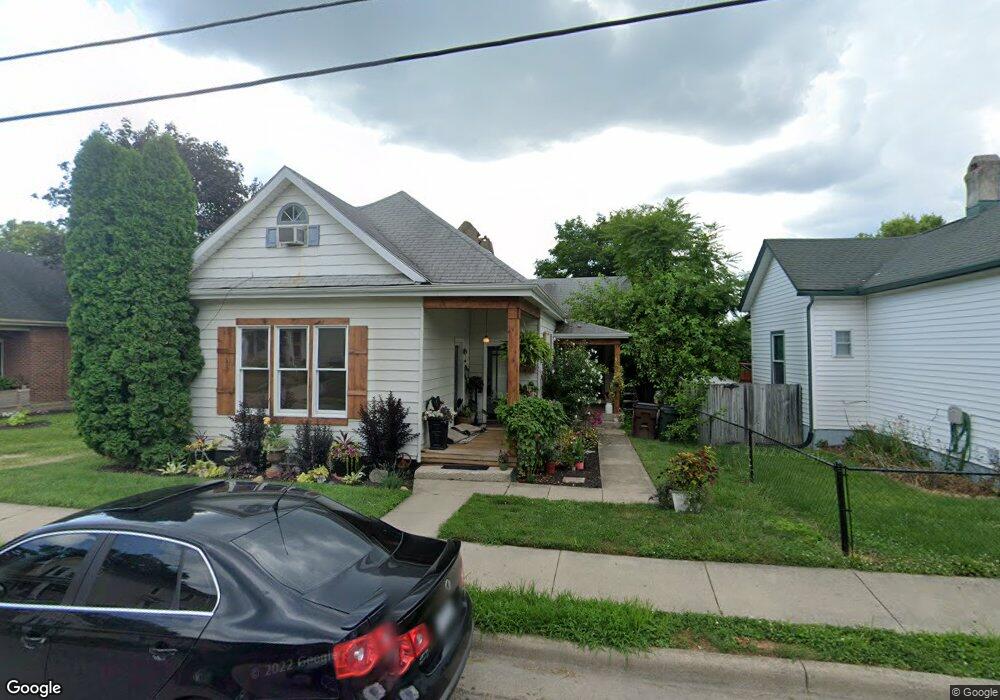
This home is located at 630 Chestnut St, Xenia, OH 45385 and is currently estimated at $151,369, approximately $76 per square foot. 630 Chestnut St is a home located in Greene County with nearby schools including Xenia High School, Summit Academy Community School for Alternative Learners - Xenia, and Legacy Christian Academy.
Ownership History
Date
Name
Owned For
Owner Type
Purchase Details
Closed on
Oct 16, 2006
Sold by
Deutsche Bank Trust Co Americas
Bought by
Stone Dennis
Current Estimated Value
Purchase Details
Closed on
May 22, 2006
Sold by
Storer Audrea and Storer David
Bought by
Deutsche Bank Trust Co Americas and Bankers Trust Co
Purchase Details
Closed on
Jun 27, 2001
Sold by
Keadle Jeffrey P and Keadle Holly A
Bought by
Storer Audrea
Home Financials for this Owner
Home Financials are based on the most recent Mortgage that was taken out on this home.
Original Mortgage
$56,000
Interest Rate
9.49%
Purchase Details
Closed on
Jun 8, 2001
Sold by
Keadle Philip B and Keadle Judy A
Bought by
Keadle Jeffrey P and Keadle Holly A
Home Financials for this Owner
Home Financials are based on the most recent Mortgage that was taken out on this home.
Original Mortgage
$56,000
Interest Rate
9.49%
Create a Home Valuation Report for This Property
The Home Valuation Report is an in-depth analysis detailing your home's value as well as a comparison with similar homes in the area
Home Values in the Area
Average Home Value in this Area
Purchase History
| Date | Buyer | Sale Price | Title Company |
|---|---|---|---|
| Stone Dennis | $24,000 | Resource Title Agency Inc | |
| Deutsche Bank Trust Co Americas | $40,000 | None Available | |
| Storer Audrea | $70,000 | -- | |
| Keadle Jeffrey P | -- | -- |
Source: Public Records
Mortgage History
| Date | Status | Borrower | Loan Amount |
|---|---|---|---|
| Previous Owner | Storer Audrea | $56,000 |
Source: Public Records
Tax History
| Year | Tax Paid | Tax Assessment Tax Assessment Total Assessment is a certain percentage of the fair market value that is determined by local assessors to be the total taxable value of land and additions on the property. | Land | Improvement |
|---|---|---|---|---|
| 2025 | $1,651 | $37,920 | $6,010 | $31,910 |
| 2024 | $1,651 | $37,920 | $6,010 | $31,910 |
| 2023 | $1,623 | $37,920 | $6,010 | $31,910 |
| 2022 | $1,427 | $28,440 | $4,810 | $23,630 |
| 2021 | $1,446 | $28,440 | $4,810 | $23,630 |
| 2020 | $1,430 | $28,440 | $4,810 | $23,630 |
| 2019 | $1,430 | $27,630 | $5,380 | $22,250 |
| 2018 | $1,435 | $27,630 | $5,380 | $22,250 |
| 2017 | $1,372 | $27,630 | $5,380 | $22,250 |
| 2016 | $1,373 | $25,930 | $5,380 | $20,550 |
| 2015 | $580 | $25,930 | $5,380 | $20,550 |
| 2014 | -- | $25,930 | $5,380 | $20,550 |
Source: Public Records
Map
Nearby Homes
- 622 Chestnut St
- 644 Chestnut St
- 614 Chestnut St
- 652 Chestnut St
- 625 Xenia Ave
- 600 Chestnut St
- 617 Xenia Ave
- 120 Owens Ave
- 676 Chestnut St
- 102 Owens Ave
- 643 Chestnut St
- 635 Chestnut St
- 592 Chestnut St
- 625 Chestnut St
- 641 Xenia Ave
- 649 Chestnut St
- 112 Owens Ave
- 617 Chestnut St
- 657 Chestnut St
- 684 Chestnut St
Your Personal Tour Guide
Ask me questions while you tour the home.