
Seller's Agent in 2025
Megan Christensen
Texas Life Real Estate
(903) 818-6079
36 in this area
106 Total Sales


Estimated Value: $184,937 - $188,000
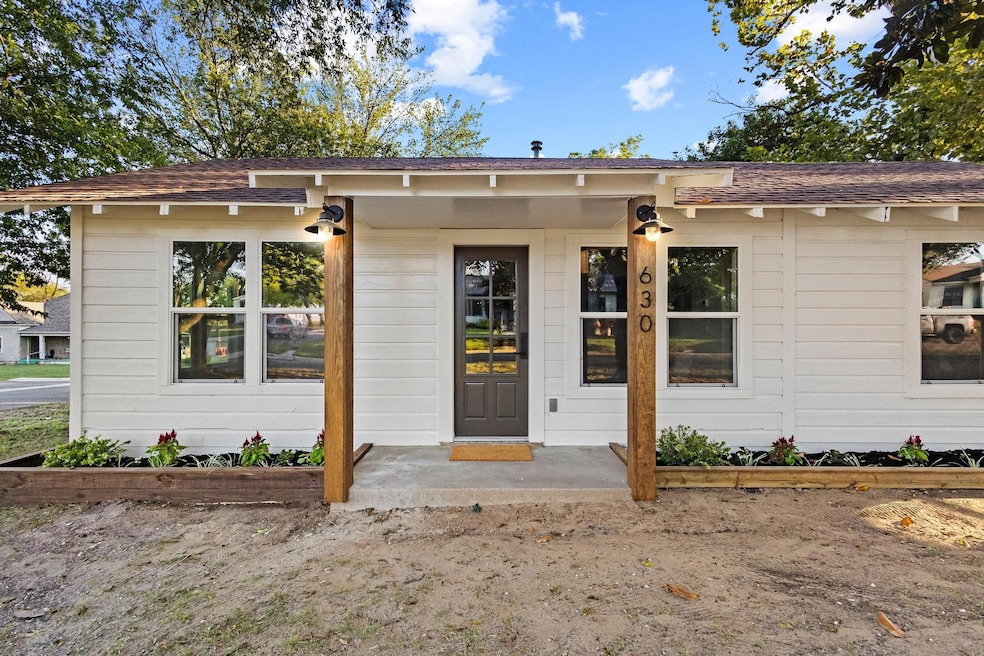
Just a few blocks from President Dwight D. Eisenhower's birthplace, you will find this well-preserved 1940's bungalow on a double corner lot. If the majestic magnolia tree doesn't steal your heart, then the interior will! The kitchen wows with newly released Aston green cabinets with slim front design and soft-close hinges. The butcherblock countertops pair perfectly with the newly laid LVP flooring throughout the home. The black stainless appliances and sink give that bold edge. The laundry room is both functional and stylish with a built-in shoe cubby and a collapsible table for folding laundry or working from home. The primary bedroom is one you might see in a million-dollar home with vaulted ceilings and oxblood sconces, each on a separate switch, so your partner can sleep while you read. The primary bathroom features a porcelain mosaic tile floor and vertically laid oxblood zellige tile with chocolate grout in the oversized shower. The burlwood vanity further elevates the bathroom. Outside, you'll notice that the street has been newly paved, and the carport shows off a modern wood-slat finish. The welcoming exterior features a six-lite front door, custom flower planters and posts stained to match. There is an extra storage room behind the carport with electricity in case you want to play wood shop or store your seasonal decor! Renovated from top to bottom by Nordic Nest LLC, this bungalow has all-new plumbing, electrical, HVAC, flooring, doors, and cabinetry—so you can move in without the stress. It may be cozy in size, but it’s packed with personality, smart design, and serious style. Affordable never looked this good!
Last Agent to Sell the Property
Texas Life Real Estate Brokerage Phone: 903-818-6079 License #0682136 Listed on: 10/02/2025
We collect this data history from publicly available records. To have your information removed, we recommend requesting removal directly through your county’s website.
| Date | Buyer | Sale Price | Title Company |
|---|---|---|---|
| Nordic Nest Llc | -- | Red River Title |
We collect this data history from publicly available records. To have your information removed, we recommend requesting removal directly through your county’s website.
| Date | Status | Borrower | Loan Amount |
|---|---|---|---|
| Open | Nordic Nest Llc | $149,100 |
| Date | Event | Price | List to Sale | Price per Sq Ft |
|---|---|---|---|---|
| 11/17/2025 11/17/25 | Sold | -- | -- | -- |
| 10/09/2025 10/09/25 | Pending | -- | -- | -- |
| 10/02/2025 10/02/25 | For Sale | $189,900 | -- | $206 / Sq Ft |
| Year | Tax Paid | Tax Assessment Tax Assessment Total Assessment is a certain percentage of the fair market value that is determined by local assessors to be the total taxable value of land and additions on the property. | Land | Improvement |
|---|---|---|---|---|
| 2025 | $1,675 | $72,069 | $48,776 | $23,293 |
| 2024 | $1,675 | $72,088 | $47,840 | $24,248 |
| 2023 | $2,029 | $89,573 | $64,064 | $25,509 |
| 2022 | $1,144 | $48,152 | $25,584 | $22,568 |
| 2021 | $1,023 | $40,569 | $20,696 | $19,873 |
| 2020 | $1,047 | $39,710 | $18,512 | $21,198 |
| 2019 | $947 | $34,420 | $12,272 | $22,148 |
| 2018 | $646 | $23,298 | $7,176 | $16,122 |
| 2017 | $388 | $13,883 | $4,784 | $9,099 |
| 2016 | $378 | $13,497 | $4,800 | $8,697 |
| 2015 | $154 | $13,476 | $4,800 | $8,676 |
| 2014 | $138 | $12,296 | $4,800 | $7,496 |
Seller's Agent in 2025
Megan Christensen
Texas Life Real Estate
(903) 818-6079
36 in this area
106 Total Sales
Buyer's Agent in 2025
Steve Cobb
PARAGON, REALTORS
(903) 267-0585
26 in this area
80 Total Sales
Source: North Texas Real Estate Information Systems (NTREIS)
MLS Number: 21074590
APN: 146769
Disclaimer: Certain information contained herein is derived from information provided by parties other than Homes.com. All information provided is deemed reliable, but is not guaranteed to be accurate and should be independently verified.
![]() Listing information provided in part by the North Texas Real Estate Information Systems, Inc, for personal, non-commercial use by viewers of this site and may not be reproduced or redistributed. All information is deemed reliable but not guaranteed. Copyright © NTREIS 2026. All rights reserved
Listing information provided in part by the North Texas Real Estate Information Systems, Inc, for personal, non-commercial use by viewers of this site and may not be reproduced or redistributed. All information is deemed reliable but not guaranteed. Copyright © NTREIS 2026. All rights reserved
Ask me questions while you tour the home.