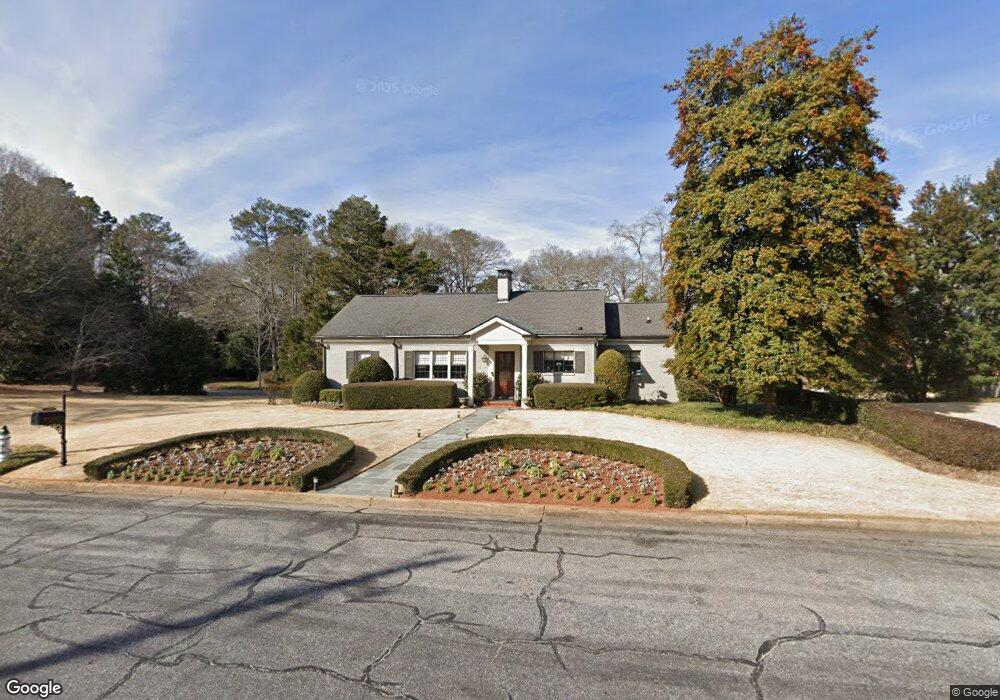
630 W Cloverhurst Ave Athens, GA 30606
Five Points NeighborhoodEstimated Value: $1,152,000 - $1,593,000
4
Beds
3
Baths
2,000
Sq Ft
$687/Sq Ft
Est. Value
About This Home
This home is located at 630 W Cloverhurst Ave, Athens, GA 30606 and is currently estimated at $1,373,293, approximately $686 per square foot. 630 W Cloverhurst Ave is a home located in Clarke County with nearby schools including Barrow Elementary School, Clarke Middle School, and Clarke Central High School.
Ownership History
Date
Name
Owned For
Owner Type
Purchase Details
Closed on
Nov 6, 2019
Sold by
Veal Jerry N
Bought by
Gibney and Sherman Sherrie G
Current Estimated Value
Home Financials for this Owner
Home Financials are based on the most recent Mortgage that was taken out on this home.
Original Mortgage
$484,300
Outstanding Balance
$420,224
Interest Rate
3.5%
Estimated Equity
$953,069
Purchase Details
Closed on
Apr 25, 2014
Sold by
Jackson Charles L
Bought by
Veal Jerry N
Purchase Details
Closed on
Jan 29, 2004
Sold by
Jackson Charles L
Bought by
Jackson Ruth F Life Estate
Purchase Details
Closed on
Nov 22, 2003
Sold by
Jackson Ruth F Life Estate
Bought by
Jackson Ruth F
Purchase Details
Closed on
Nov 21, 2001
Sold by
Jackson Charles L
Bought by
Jackson Ruth F Life Estate
Purchase Details
Closed on
Aug 14, 1996
Sold by
Jackson Charles Lee
Bought by
Jackson Ruth F
Create a Home Valuation Report for This Property
The Home Valuation Report is an in-depth analysis detailing your home's value as well as a comparison with similar homes in the area
Home Values in the Area
Average Home Value in this Area
Purchase History
| Date | Buyer | Sale Price | Title Company |
|---|---|---|---|
| Gibney | $675,000 | -- | |
| Veal Jerry N | $487,500 | -- | |
| Jackson Ruth F Life Estate | -- | -- | |
| Jackson Ruth F | -- | -- | |
| Jackson Ruth F Life Estate | -- | -- | |
| Jackson Charles L | -- | -- | |
| Jackson Ruth F | -- | -- | |
| Jackson Charles Lee | $175,000 | -- |
Source: Public Records
Mortgage History
| Date | Status | Borrower | Loan Amount |
|---|---|---|---|
| Open | Gibney | $484,300 |
Source: Public Records
Tax History
| Year | Tax Paid | Tax Assessment Tax Assessment Total Assessment is a certain percentage of the fair market value that is determined by local assessors to be the total taxable value of land and additions on the property. | Land | Improvement |
|---|---|---|---|---|
| 2025 | $10,114 | $485,762 | $88,800 | $396,962 |
| 2024 | $10,114 | $415,521 | $88,800 | $326,721 |
| 2023 | $10,192 | $381,616 | $88,800 | $292,816 |
| 2022 | $9,755 | $347,785 | $86,400 | $261,385 |
| 2021 | $9,692 | $303,536 | $86,400 | $217,136 |
| 2020 | $8,762 | $288,398 | $86,400 | $201,998 |
| 2019 | $9,588 | $292,409 | $86,400 | $206,009 |
| 2018 | $7,627 | $234,642 | $72,000 | $162,642 |
| 2017 | $7,535 | $231,932 | $72,000 | $159,932 |
| 2016 | $7,259 | $223,800 | $72,000 | $151,800 |
| 2015 | $6,290 | $231,942 | $67,200 | $164,742 |
| 2014 | $8,025 | $235,672 | $67,200 | $168,472 |
Source: Public Records
Map
Nearby Homes
- 577 W Cloverhurst Ave
- 112 Fortson Dr
- 121 Fortson Cir
- 1055 Baxter St Unit 201
- 338 Springdale St
- 230 Woodlawn Ave
- 490 Mcwhorter Dr
- 206 Fortson Dr
- 224 Fortson Dr
- 590 Highland Ave
- 849 Bobbin Mill Rd
- 997 S Milledge Ave Unit 3
- 997 S Milledge Ave Unit 1
- 997 S Milledge Ave Unit 2
- 997 S Milledge Ave Unit 4
- 290 Fortson Dr
- 1075 Baxter St Unit A306
- 1075 Baxter St Unit A304
- 195 Rock Glen Rd
- 1554 S Lumpkin St Unit 4
- 590 W Cloverhurst Ave
- 560 W Cloverhurst Ave
- 535 Springdale St
- 585 W Cloverhurst Ave
- 530 Springdale St
- 625 W Cloverhurst Ave
- 550 W Cloverhurst Ave
- 569 W Cloverhurst Ave
- 515 Springdale St
- 635 W Cloverhurst Ave
- 520 Springdale St
- 565 W Cloverhurst Ave
- 540 W Cloverhurst Ave
- 123 Fortson Dr
- W W Cloverhurst Ave
- 555 W Cloverhurst Ave
- 497 Springdale St
- 150 Mcwhorter Dr
- 195 Mcwhorter Dr
- 590 Springdale St
Your Personal Tour Guide
Ask me questions while you tour the home.