630 West St Uxbridge, MA 01569
Estimated Value: $558,000 - $626,000
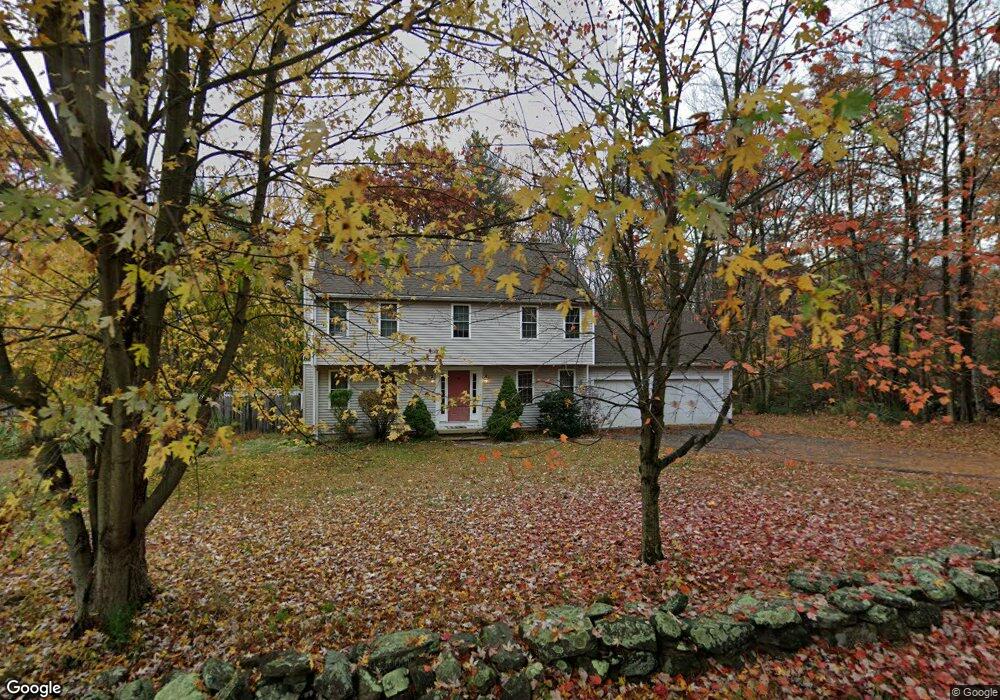
About This Home
This home is located at 630 West St, Uxbridge, MA 01569 and is currently estimated at $602,568, approximately $334 per square foot. 630 West St is a home located in Worcester County with nearby schools including Uxbridge High School.
Ownership History
We collect this data history from publicly available records. To have your information removed, we recommend requesting removal directly through your county’s website.
Purchase Details
Home Financials for this Owner
Home Financials are based on the most recent Mortgage that was taken out on this home.Home Values in the Area
Average Home Value in this Area
Purchase History
We collect this data history from publicly available records. To have your information removed, we recommend requesting removal directly through your county’s website.
| Date | Buyer | Sale Price | Title Company |
|---|---|---|---|
| $336,500 | -- |
Mortgage History
We collect this data history from publicly available records. To have your information removed, we recommend requesting removal directly through your county’s website.
| Date | Status | Borrower | Loan Amount |
|---|---|---|---|
| Open | $269,200 |
Tax History
We collect this data history from publicly available records. To have your information removed, we recommend requesting removal directly through your county’s website.
| Year | Tax Paid | Tax Assessment Tax Assessment Total Assessment is a certain percentage of the fair market value that is determined by local assessors to be the total taxable value of land and additions on the property. | Land | Improvement |
|---|---|---|---|---|
| 2025 | $66 | $504,600 | $147,800 | $356,800 |
| 2024 | $6,275 | $485,700 | $140,200 | $345,500 |
| 2023 | $5,990 | $429,400 | $121,300 | $308,100 |
| 2022 | $5,429 | $358,100 | $106,100 | $252,000 |
| 2021 | $5,629 | $355,800 | $103,800 | $252,000 |
| 2020 | $5,762 | $344,200 | $102,300 | $241,900 |
| 2019 | $5,706 | $328,900 | $102,300 | $226,600 |
| 2018 | $5,572 | $324,500 | $102,300 | $222,200 |
| 2017 | $5,141 | $303,100 | $101,000 | $202,100 |
| 2016 | $5,180 | $294,800 | $87,700 | $207,100 |
| 2015 | $5,060 | $290,800 | $87,700 | $203,100 |
Map
- 25 Stanphyl Rd
- 53 Arnold Way
- 5 White Ct
- 145 Turner Farm Rd
- Lot 43 Turner Farm Rd
- 20 Turner Farm Rd
- 7 Lamire Way
- 93 Mantell Rd
- 2 Isabella Dr
- 307 S East Main St Unit Lot 9
- 299 S East Main St Unit Lot 8
- 6 Chamberlain Rd
- 235 Yew St
- 59 Tea Party Dr
- 56 King St
- 115 Hunter Rd
- 2 Loyalist Dr Unit 2
- 545 Hazel St
- 150 Hazel St
- 93 Franklin St
Ask me questions while you tour the home.