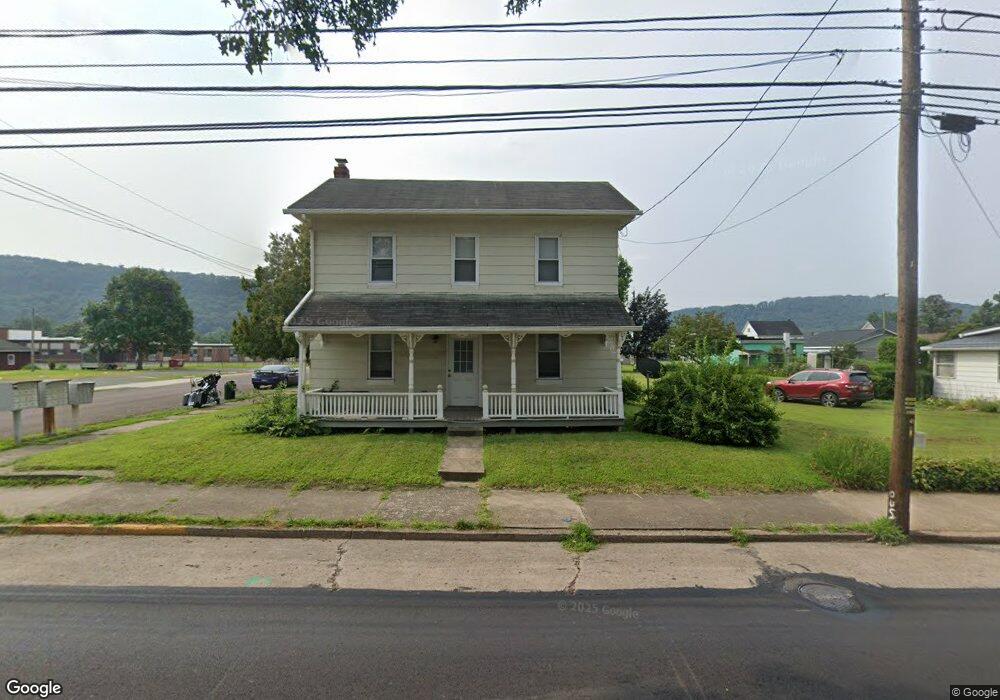
632 3rd St Nescopeck, PA 18635
Estimated Value: $91,000 - $301,000
Studio
--
Bath
1,116
Sq Ft
$179/Sq Ft
Est. Value
About This Home
This home is located at 632 3rd St, Nescopeck, PA 18635 and is currently estimated at $199,333, approximately $178 per square foot. 632 3rd St is a home located in Luzerne County with nearby schools including Berwick Area High School, Holy Family Consolidated School, and New Story School.
Ownership History
Date
Name
Owned For
Owner Type
Purchase Details
Closed on
Apr 5, 2017
Sold by
Benscoter Andrea Rae and Estate Of Richard A Benscoter
Bought by
Benscoter Andrea Rae
Current Estimated Value
Purchase Details
Closed on
Sep 25, 2014
Sold by
Benscoter Richard A
Bought by
Benscoter Richard A and Benscoter Andrea Rae
Purchase Details
Closed on
Mar 17, 2011
Sold by
Benscoter Andrea Rae
Bought by
Benscoter Richard A
Purchase Details
Closed on
Jul 12, 2006
Sold by
Benscoter Richard A
Bought by
Benscoter Andrea Rae
Create a Home Valuation Report for This Property
The Home Valuation Report is an in-depth analysis detailing your home's value as well as a comparison with similar homes in the area
Home Values in the Area
Average Home Value in this Area
Purchase History
| Date | Buyer | Sale Price | Title Company |
|---|---|---|---|
| Benscoter Andrea Rae | $25,000 | None Available | |
| Benscoter Richard A | -- | None Available | |
| Benscoter Richard A | -- | None Available | |
| Benscoter Andrea Rae | -- | None Available |
Source: Public Records
Tax History
| Year | Tax Paid | Tax Assessment Tax Assessment Total Assessment is a certain percentage of the fair market value that is determined by local assessors to be the total taxable value of land and additions on the property. | Land | Improvement |
|---|---|---|---|---|
| 2026 | $957 | $42,000 | $16,600 | $25,400 |
| 2025 | $944 | $42,000 | $16,600 | $25,400 |
| 2024 | $915 | $42,000 | $16,600 | $25,400 |
| 2023 | $879 | $42,000 | $16,600 | $25,400 |
| 2022 | $871 | $42,000 | $16,600 | $25,400 |
| 2021 | $804 | $42,000 | $16,600 | $25,400 |
| 2020 | $780 | $42,000 | $16,600 | $25,400 |
| 2019 | $774 | $42,000 | $16,600 | $25,400 |
| 2018 | $768 | $42,000 | $16,600 | $25,400 |
| 2017 | $799 | $42,000 | $16,600 | $25,400 |
| 2016 | -- | $42,000 | $16,600 | $25,400 |
| 2015 | -- | $42,000 | $16,600 | $25,400 |
| 2014 | -- | $42,000 | $16,600 | $25,400 |
Source: Public Records
Map
Nearby Homes
Your Personal Tour Guide
Ask me questions while you tour the home.