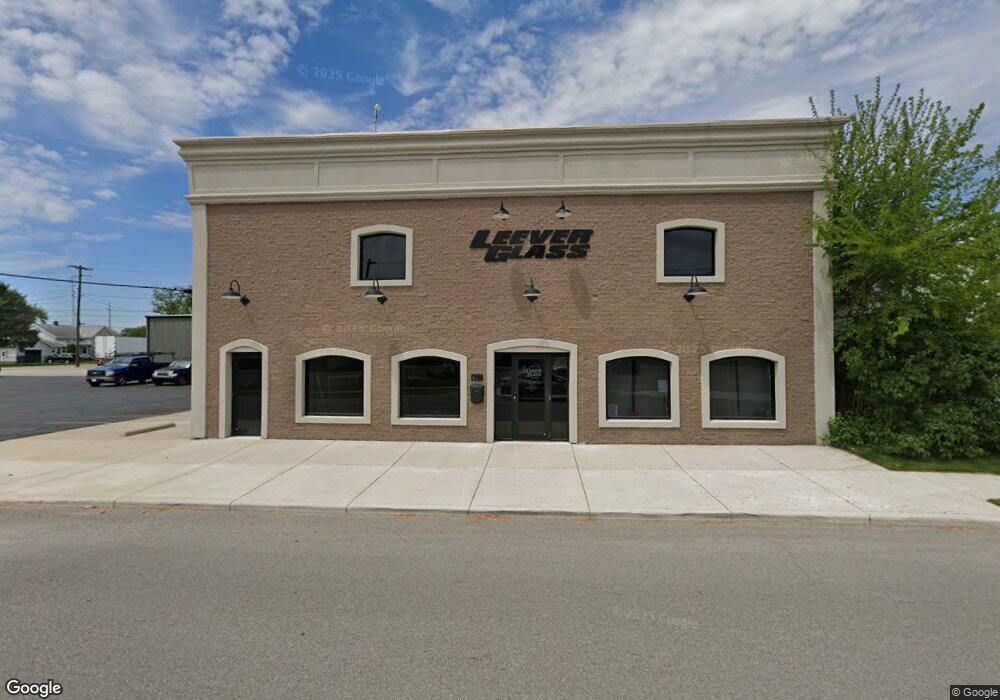
632 Perry St Defiance, OH 43512
Estimated Value: $402,048
Studio
2
Baths
3,600
Sq Ft
$112/Sq Ft
Est. Value
About This Home
This home is located at 632 Perry St, Defiance, OH 43512 and is currently priced at $402,048, approximately $111 per square foot. 632 Perry St is a home located in Defiance County with nearby schools including Defiance Elementary School, Defiance Middle School, and Defiance High School.
Ownership History
Date
Name
Owned For
Owner Type
Purchase Details
Closed on
Apr 28, 2023
Sold by
T26 Properties Llc
Bought by
Jkeac Properties Llc
Current Estimated Value
Purchase Details
Closed on
Oct 6, 2015
Sold by
L N Enterprises
Bought by
T26 Properties Llc
Home Financials for this Owner
Home Financials are based on the most recent Mortgage that was taken out on this home.
Original Mortgage
$140,000
Interest Rate
3.91%
Mortgage Type
Future Advance Clause Open End Mortgage
Purchase Details
Closed on
Jan 1, 1993
Create a Home Valuation Report for This Property
The Home Valuation Report is an in-depth analysis detailing your home's value as well as a comparison with similar homes in the area
Home Values in the Area
Average Home Value in this Area
Purchase History
| Date | Buyer | Sale Price | Title Company |
|---|---|---|---|
| Jkeac Properties Llc | $575,000 | None Listed On Document | |
| T26 Properties Llc | $251,000 | None Available | |
| -- | -- | -- |
Source: Public Records
Mortgage History
| Date | Status | Borrower | Loan Amount |
|---|---|---|---|
| Previous Owner | T26 Properties Llc | $140,000 |
Source: Public Records
Tax History
| Year | Tax Paid | Tax Assessment Tax Assessment Total Assessment is a certain percentage of the fair market value that is determined by local assessors to be the total taxable value of land and additions on the property. | Land | Improvement |
|---|---|---|---|---|
| 2025 | $1,149 | $23,860 | $3,480 | $20,380 |
| 2024 | $1,149 | $23,860 | $3,480 | $20,380 |
| 2023 | $1,147 | $23,860 | $3,480 | $20,380 |
| 2022 | $1,177 | $22,530 | $3,480 | $19,050 |
| 2021 | $1,177 | $22,530 | $3,480 | $19,050 |
| 2020 | $1,208 | $22,530 | $3,480 | $19,050 |
| 2019 | $1,220 | $22,530 | $3,480 | $19,050 |
| 2018 | $1,196 | $22,530 | $3,480 | $19,050 |
| 2017 | $1,190 | $22,533 | $3,482 | $19,051 |
| 2016 | $1,215 | $22,253 | $3,402 | $18,851 |
| 2015 | $572 | $22,253 | $3,402 | $18,851 |
| 2014 | $572 | $22,253 | $3,402 | $18,851 |
| 2013 | $572 | $22,253 | $3,402 | $18,851 |
| 2012 | $572 | $22,253 | $3,402 | $18,851 |
Source: Public Records
Map
Nearby Homes
Your Personal Tour Guide
Ask me questions while you tour the home.