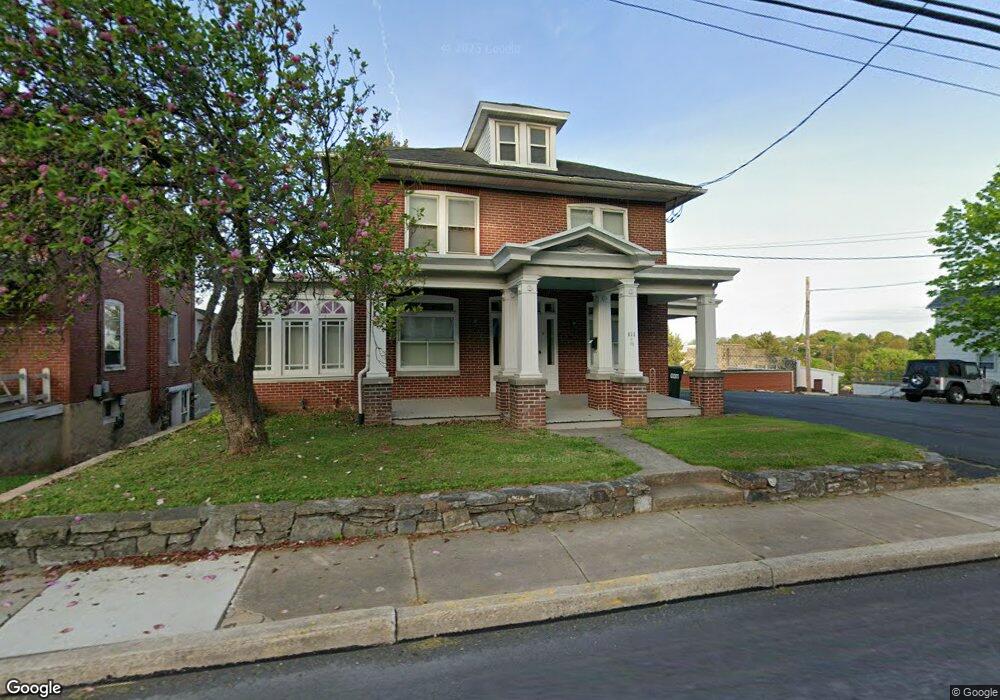
633 E Main St Ephrata, PA 17522
Estimated Value: $268,000 - $333,000
2
Beds
2
Baths
2,349
Sq Ft
$127/Sq Ft
Est. Value
About This Home
This home is located at 633 E Main St, Ephrata, PA 17522 and is currently estimated at $298,302, approximately $126 per square foot. 633 E Main St is a home located in Lancaster County with nearby schools including Fulton El School, Ephrata Intermediate School, and Ephrata Senior High School.
Ownership History
Date
Name
Owned For
Owner Type
Purchase Details
Closed on
Dec 23, 2025
Sold by
Hocking Julie A and Hocking Family Trust
Bought by
John Jane Llc
Current Estimated Value
Home Financials for this Owner
Home Financials are based on the most recent Mortgage that was taken out on this home.
Original Mortgage
$220,000
Outstanding Balance
$218,939
Interest Rate
6.22%
Mortgage Type
Seller Take Back
Estimated Equity
$79,363
Create a Home Valuation Report for This Property
The Home Valuation Report is an in-depth analysis detailing your home's value as well as a comparison with similar homes in the area
Home Values in the Area
Average Home Value in this Area
Purchase History
We collect this data history from publicly available records. To have your information removed, we recommend requesting removal directly through your county’s website.
| Date | Buyer | Sale Price | Title Company |
|---|---|---|---|
| John Jane Llc | $270,000 | None Listed On Document |
Source: Public Records
Mortgage History
We collect this data history from publicly available records. To have your information removed, we recommend requesting removal directly through your county’s website.
| Date | Status | Borrower | Loan Amount |
|---|---|---|---|
| Open | John Jane Llc | $220,000 |
Source: Public Records
Tax History
| Year | Tax Paid | Tax Assessment Tax Assessment Total Assessment is a certain percentage of the fair market value that is determined by local assessors to be the total taxable value of land and additions on the property. | Land | Improvement |
|---|---|---|---|---|
| 2025 | $4,338 | $180,900 | $49,100 | $131,800 |
| 2024 | $4,338 | $180,900 | $49,100 | $131,800 |
| 2023 | $4,231 | $180,900 | $49,100 | $131,800 |
| 2022 | $4,051 | $180,900 | $49,100 | $131,800 |
| 2021 | $3,966 | $180,900 | $49,100 | $131,800 |
| 2020 | $3,966 | $180,900 | $49,100 | $131,800 |
| 2019 | $3,912 | $180,900 | $49,100 | $131,800 |
| 2018 | $4,637 | $180,900 | $49,100 | $131,800 |
| 2017 | $3,721 | $140,600 | $38,400 | $102,200 |
| 2016 | $3,691 | $140,600 | $38,400 | $102,200 |
| 2015 | $816 | $140,600 | $38,400 | $102,200 |
| 2014 | $2,756 | $140,600 | $38,400 | $102,200 |
Source: Public Records
Map
Nearby Homes
- 154 Julie Ann Ct
- 8 Westpointe Dr Unit 8
- 113 E Franklin St
- 122 Boomerang Dr
- 369 Lake St
- 214 Cherry St
- 485 N Maple St
- 446 Lincoln Ave
- 239 Railroad Ave
- 189 Ridge Ave
- 43 E Walnut St
- 407 Lake St
- 18 Copperwood Ln
- 214 Duke St
- 127 Church Ave
- 200 Pleasant Valley Rd
- 144 Church Ave
- 287 Duke St
- 202 W Franklin St
- 224 Irene Ave
Your Personal Tour Guide
Ask me questions while you tour the home.