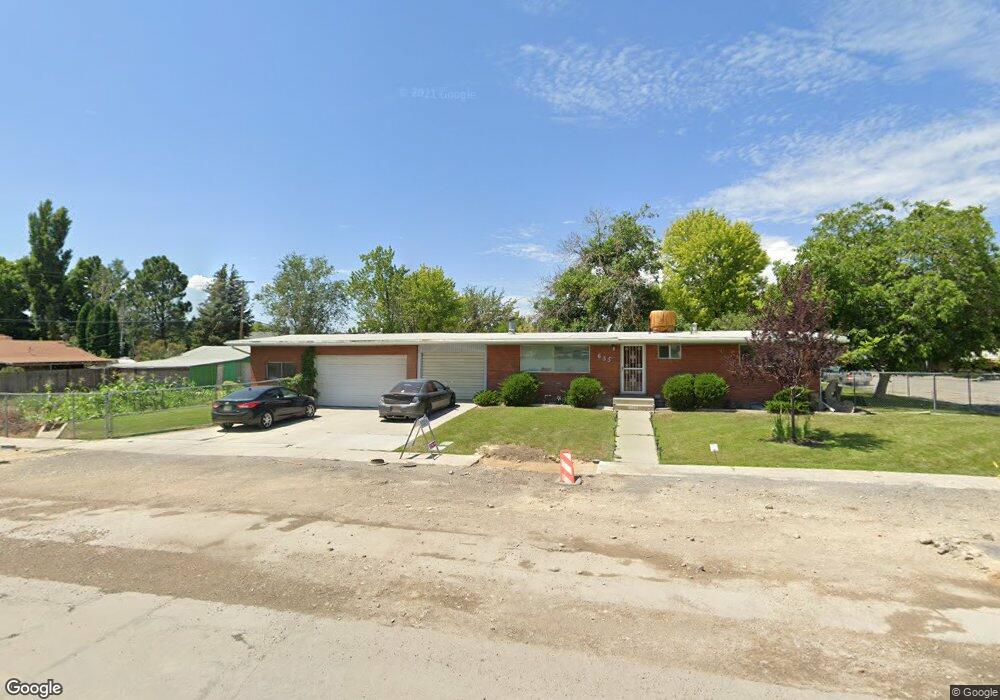
635 N 600 E American Fork, UT 84003
Estimated Value: $433,000 - $560,000
4
Beds
1
Bath
2,150
Sq Ft
$234/Sq Ft
Est. Value
About This Home
This home is located at 635 N 600 E, American Fork, UT 84003 and is currently estimated at $502,272, approximately $233 per square foot. 635 N 600 E is a home located in Utah County with nearby schools including Forbes Elementary School, American Fork Junior High School, and American Fork High School.
Ownership History
Date
Name
Owned For
Owner Type
Purchase Details
Closed on
Nov 9, 2018
Sold by
Garrett Brian and Garrett Lisa
Bought by
Garrett Properties Llc
Current Estimated Value
Purchase Details
Closed on
Jan 26, 2018
Sold by
Johnson Gilda Louise and F & G Johnson Trust
Bought by
Garrett Brian and Garrett Lisa
Home Financials for this Owner
Home Financials are based on the most recent Mortgage that was taken out on this home.
Original Mortgage
$183,750
Outstanding Balance
$155,385
Interest Rate
3.93%
Mortgage Type
New Conventional
Estimated Equity
$346,887
Create a Home Valuation Report for This Property
The Home Valuation Report is an in-depth analysis detailing your home's value as well as a comparison with similar homes in the area
Home Values in the Area
Average Home Value in this Area
Purchase History
| Date | Buyer | Sale Price | Title Company |
|---|---|---|---|
| Garrett Properties Llc | -- | Meridian Title Co | |
| Garrett Brian | -- | Meridian Title Co |
Source: Public Records
Mortgage History
| Date | Status | Borrower | Loan Amount |
|---|---|---|---|
| Open | Garrett Brian | $183,750 |
Source: Public Records
Tax History
| Year | Tax Paid | Tax Assessment Tax Assessment Total Assessment is a certain percentage of the fair market value that is determined by local assessors to be the total taxable value of land and additions on the property. | Land | Improvement |
|---|---|---|---|---|
| 2025 | $2,086 | $261,360 | -- | -- |
| 2024 | $2,086 | $231,770 | $0 | $0 |
| 2023 | $1,923 | $226,545 | $0 | $0 |
| 2022 | $2,070 | $240,680 | $0 | $0 |
| 2021 | $1,766 | $320,600 | $159,200 | $161,400 |
| 2020 | $1,648 | $290,200 | $142,100 | $148,100 |
| 2019 | $1,549 | $282,100 | $134,000 | $148,100 |
| 2018 | $1,439 | $250,600 | $121,800 | $128,800 |
| 2017 | $1,363 | $128,095 | $0 | $0 |
| 2016 | $1,337 | $116,765 | $0 | $0 |
| 2015 | -- | $112,970 | $0 | $0 |
| 2014 | $702 | $104,830 | $0 | $0 |
Source: Public Records
Map
Nearby Homes
- 532 E 500 N
- 691 N 400 E Unit A & B Units
- 691 N 400 E Unit A & B
- 691 N 400 E
- 410 N 600 E
- 369 E 500 N
- 350 N 500 E
- 1082 N 350 E
- 952 N 400 E
- 266 N 500 E
- 272 N 400 E
- 912 E Ellens St Unit 1
- 931 E Ellens St Unit LOT 13
- 807 N 150 E
- 783 N 150 E
- 793 N 150 E
- 479 E 200 N
- 462 N 950 E Unit 5
- 822 N 150 E Unit 5
- 470 N 950 E Unit LOT 6
Your Personal Tour Guide
Ask me questions while you tour the home.