6355 Maple Crest Ct Decatur, IL 62521
Estimated Value: $326,000 - $641,779
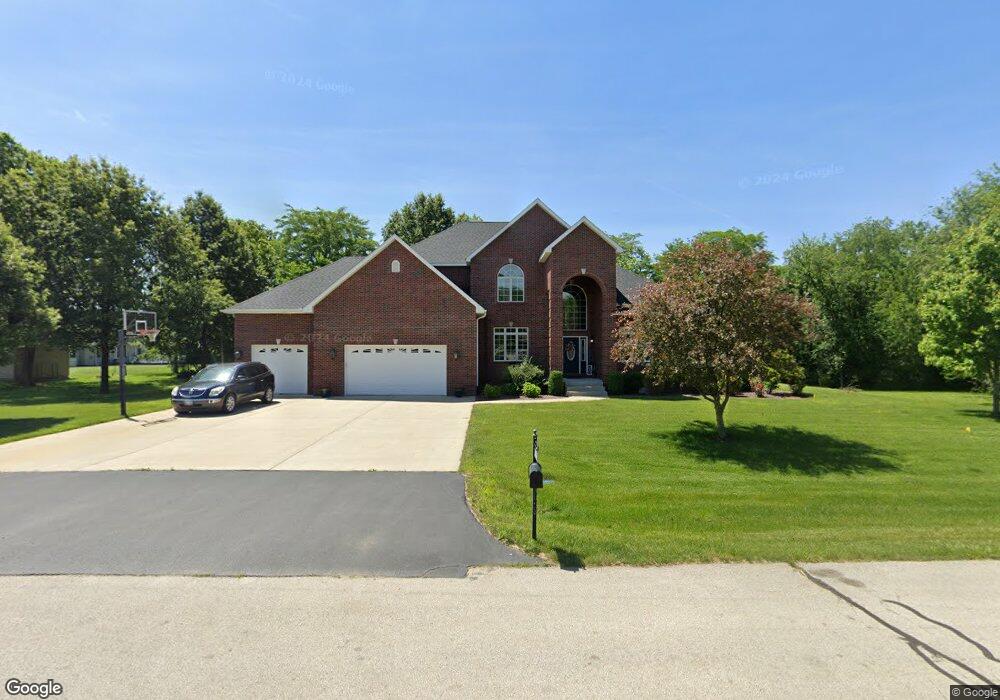
About This Home
This home is located at 6355 Maple Crest Ct, Decatur, IL 62521 and is currently estimated at $509,260, approximately $233 per square foot. 6355 Maple Crest Ct is a home with nearby schools including McGaughey Elementary School, Mt. Zion Elementary School, and Mt. Zion Intermediate School.
Ownership History
We collect this data history from publicly available records. To have your information removed, we recommend requesting removal directly through your county’s website.
Purchase Details
Purchase Details
Home Financials for this Owner
Home Financials are based on the most recent Mortgage that was taken out on this home.Purchase Details
Purchase History
We collect this data history from publicly available records. To have your information removed, we recommend requesting removal directly through your county’s website.
| Date | Buyer | Sale Price | Title Company |
|---|---|---|---|
| -- | None Listed On Document | ||
| $41,000 | None Available | ||
| $44,000 | None Available |
Mortgage History
We collect this data history from publicly available records. To have your information removed, we recommend requesting removal directly through your county’s website.
| Date | Status | Borrower | Loan Amount |
|---|---|---|---|
| Closed | $45,000 | ||
| Closed | $400,000 | ||
| Closed | $369,600 | ||
| Closed | $28,368 | ||
| Closed | $32,800 |
Tax History
We collect this data history from publicly available records. To have your information removed, we recommend requesting removal directly through your county’s website.
| Year | Tax Paid | Tax Assessment Tax Assessment Total Assessment is a certain percentage of the fair market value that is determined by local assessors to be the total taxable value of land and additions on the property. | Land | Improvement |
|---|---|---|---|---|
| 2025 | $12,581 | $208,872 | $19,073 | $189,799 |
| 2024 | $12,326 | $202,043 | $18,449 | $183,594 |
| 2023 | $11,991 | $187,738 | $17,143 | $170,595 |
| 2022 | $11,294 | $176,521 | $16,119 | $160,402 |
| 2021 | $10,988 | $167,346 | $15,281 | $152,065 |
| 2020 | $10,583 | $159,938 | $14,604 | $145,334 |
| 2019 | $10,583 | $159,938 | $14,604 | $145,334 |
| 2018 | $10,331 | $156,434 | $14,284 | $142,150 |
| 2017 | $9,588 | $154,503 | $14,108 | $140,395 |
| 2016 | $8,700 | $141,655 | $14,100 | $127,555 |
| 2015 | $8,421 | $139,837 | $13,919 | $125,918 |
| 2014 | $8,175 | $139,837 | $13,919 | $125,918 |
| 2013 | $8,421 | $129,750 | $13,919 | $115,831 |
Map
- 2609 French Dr
- 6455 Birchwood Ln
- 2420 Rolling Creek Ct
- 2312 Lot 24 Rolling Creek Dr
- 2276 Lot 26 Rolling Creek Dr
- 2258 Lot 27 Rolling Creek Dr
- 7475 E US Route 36
- 2405 Lot 14 Rolling Creek Ct
- 2347 Rolling Creek Dr
- 2415 Lot 15 Rolling Creek Ct
- 2331 Rolling Creek Dr
- 2311 Rolling Creek Dr
- 2295 Rolling Creek Dr
- 2277 Rolling Creek Dr
- 2261 Rolling Creek Dr
- 2243 Rolling Creek Dr
- 2235 Rolling Creek Dr
- 4931 E Glenwood Dr
- Lot 20 Jeffrey Ln
- Lot 9A Fletcher Ln
- 6362 Autumn Ridge
- 6362 Autumn Ridge Ct
- 6342 Autumn Ridge
- 6382 Autumn Ridge
- 6325 Maple Crest Ct
- (Lot 40B) 6322 Autumn Ridge
- (Lot 40A) 6322 Autumn Ridge
- 6220 Mayflower Dr
- 6323 Autumn Ridge Ct
- 6323 Autumn Ridge
- 6330 Maple Crest Ct
- 6302 Autumn Ridge
- 6302 Autumn Ridge Ct
- 2695 Timber Ridge Dr
- 2665 Timber Ridge Dr
- 6210 Mayflower Dr
- 2715 Timber Ridge Dr
- 2624 French Dr
- 6305 Maple Crest Ct
- 2745 Timber Ridge Dr
Ask me questions while you tour the home.