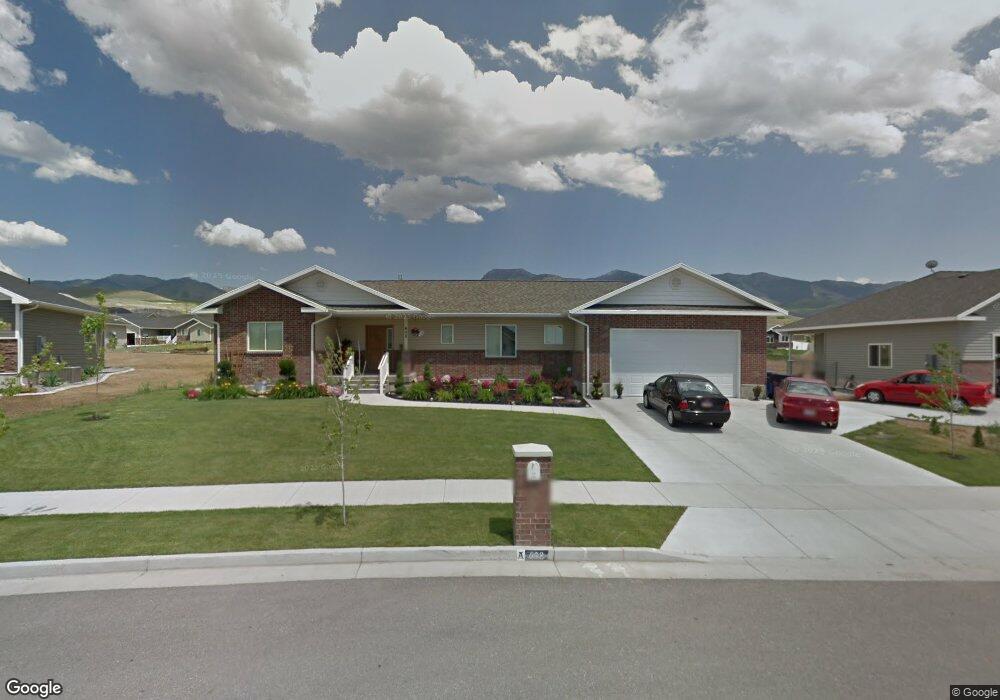
638 N 100 E Smithfield, UT 84335
Estimated Value: $372,000 - $513,000
Studio
--
Bath
1,281
Sq Ft
$353/Sq Ft
Est. Value
About This Home
This home is located at 638 N 100 E, Smithfield, UT 84335 and is currently estimated at $451,875, approximately $352 per square foot. 638 N 100 E is a home with nearby schools including Birch Creek School, North Cache Middle School, and White Pine Middle School.
Ownership History
Date
Name
Owned For
Owner Type
Purchase Details
Closed on
Aug 9, 2016
Sold by
Smith Kevin M and Smith Becky K
Bought by
Gutke Barbara W and Barbara W Gutke Revocable Trust
Current Estimated Value
Purchase Details
Closed on
May 15, 2009
Sold by
Bridgerland Applied Technology College
Bought by
Smith Kevin M and Smith Becky K
Home Financials for this Owner
Home Financials are based on the most recent Mortgage that was taken out on this home.
Original Mortgage
$149,695
Interest Rate
4.71%
Mortgage Type
New Conventional
Purchase Details
Closed on
May 8, 2008
Sold by
Hunter Meadows Development Company Inc
Bought by
Bridgerland Applied Technology College
Create a Home Valuation Report for This Property
The Home Valuation Report is an in-depth analysis detailing your home's value as well as a comparison with similar homes in the area
Home Values in the Area
Average Home Value in this Area
Purchase History
| Date | Buyer | Sale Price | Title Company |
|---|---|---|---|
| Gutke Barbara W | -- | Cache Title | |
| Smith Kevin M | -- | Cache Title Company | |
| Bridgerland Applied Technology College | -- | Northern Title Company |
Source: Public Records
Mortgage History
| Date | Status | Borrower | Loan Amount |
|---|---|---|---|
| Previous Owner | Smith Kevin M | $149,695 |
Source: Public Records
Tax History
| Year | Tax Paid | Tax Assessment Tax Assessment Total Assessment is a certain percentage of the fair market value that is determined by local assessors to be the total taxable value of land and additions on the property. | Land | Improvement |
|---|---|---|---|---|
| 2025 | $1,811 | $242,390 | $0 | $0 |
| 2024 | $2,180 | $273,750 | $0 | $0 |
| 2023 | $2,283 | $271,095 | $0 | $0 |
| 2022 | $2,320 | $271,095 | $0 | $0 |
| 2021 | $1,777 | $317,299 | $69,000 | $248,299 |
| 2020 | $1,711 | $284,913 | $69,000 | $215,913 |
| 2019 | $1,671 | $265,193 | $49,280 | $215,913 |
| 2018 | $1,577 | $242,060 | $49,280 | $192,780 |
| 2017 | $1,527 | $128,085 | $0 | $0 |
| 2016 | $1,554 | $106,005 | $0 | $0 |
| 2015 | $1,291 | $106,005 | $0 | $0 |
| 2014 | $1,263 | $105,740 | $0 | $0 |
| 2013 | -- | $105,740 | $0 | $0 |
Source: Public Records
Map
Nearby Homes
Your Personal Tour Guide
Ask me questions while you tour the home.