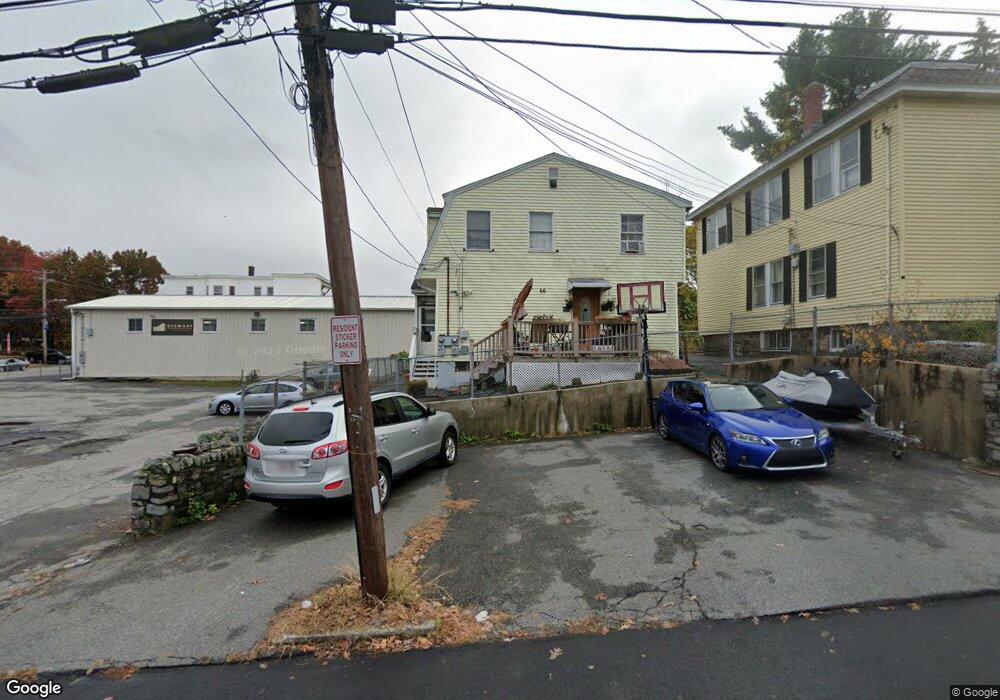
64-66 Lynn St Lawrence, MA 01843
Colonial Heights NeighborhoodEstimated Value: $718,292 - $931,000
About This Home
This home is located at 64-66 Lynn St, Lawrence, MA 01843 and is currently estimated at $864,323, approximately $284 per square foot. 64-66 Lynn St is a home located in Essex County with nearby schools including John Breen School, South Lawrence East Elementary School, and School For Exceptional Studies.
Ownership History
We collect this data history from publicly available records. To have your information removed, we recommend requesting removal directly through your county’s website.
Purchase Details
Home Financials for this Owner
Home Financials are based on the most recent Mortgage that was taken out on this home.Home Values in the Area
Average Home Value in this Area
Purchase History
We collect this data history from publicly available records. To have your information removed, we recommend requesting removal directly through your county’s website.
| Date | Buyer | Sale Price | Title Company |
|---|---|---|---|
| $125,000 | -- |
Mortgage History
We collect this data history from publicly available records. To have your information removed, we recommend requesting removal directly through your county’s website.
| Date | Status | Borrower | Loan Amount |
|---|---|---|---|
| Open | $10,000 | ||
| Open | $100,000 | ||
| Previous Owner | $110,000 | ||
| Previous Owner | $10,000 |
Tax History
We collect this data history from publicly available records. To have your information removed, we recommend requesting removal directly through your county’s website.
| Year | Tax Paid | Tax Assessment Tax Assessment Total Assessment is a certain percentage of the fair market value that is determined by local assessors to be the total taxable value of land and additions on the property. | Land | Improvement |
|---|---|---|---|---|
| 2025 | $5,920 | $672,700 | $99,700 | $573,000 |
| 2024 | $5,931 | $641,200 | $107,900 | $533,300 |
| 2023 | $5,773 | $568,200 | $100,100 | $468,100 |
| 2022 | $5,810 | $507,900 | $90,700 | $417,200 |
| 2021 | $5,671 | $462,200 | $90,700 | $371,500 |
| 2020 | $5,066 | $407,600 | $86,000 | $321,600 |
| 2019 | $5,298 | $387,300 | $71,400 | $315,900 |
| 2018 | $5,220 | $364,500 | $67,700 | $296,800 |
| 2017 | $4,746 | $309,400 | $63,900 | $245,500 |
| 2016 | $4,701 | $303,100 | $52,700 | $250,400 |
| 2015 | $4,509 | $298,200 | $52,700 | $245,500 |
Map
- 5 Lafayette Ave
- 401 S Broadway
- 17 Gorham St
- 539-541 S Broadway
- 33 Garfield St
- 139-141 Foster St
- 199-205 Boxford St
- 17 Juliette St
- 8 Brookfield St
- 191 Farnham St
- 77 Corbett St
- 14 Tyler St Unit 1
- 25 Margate Rd
- 28 Elmwood St
- 42 York St
- 350 Greene St Unit 102
- 350 Greene St Unit 410
- 350 Greene St Unit 306
- 82 S Broadway
- 86 S Broadway
- 575 S Union St
- 577 S Union St Unit 3
- 577 S Union St
- 573A S Union St
- 573 S Union St
- 567 S Union St
- 64 Lynn St Unit 66
- 592 S Union St
- 72 Lynn St
- 72 Lynn St Unit 1
- 601 S Union St Unit 3
- 601 S Union St Unit 4
- 601 S Union St Unit 2
- 601 S Union St Unit 1
- 602 S Union St
- 80 Lynn St
- 67 Lynn St Unit 69
- 37 Marlboro St
- 20 Marlboro St
- 556 S Union St Unit 558
Ask me questions while you tour the home.