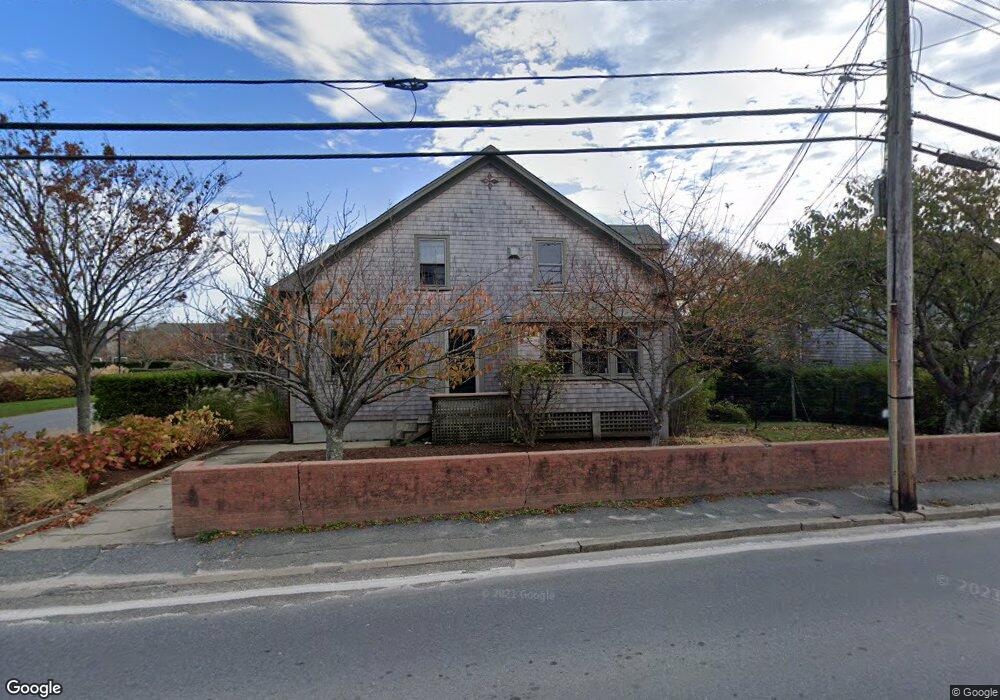
64 Union St Nantucket, MA 02554
Estimated Value: $4,022,294 - $5,414,000
Studio
--
Bath
--
Sq Ft
15,551
Sq Ft Lot
About This Home
This home is located at 64 Union St, Nantucket, MA 02554 and is currently estimated at $4,626,074. 64 Union St is a home located in Nantucket County with nearby schools including Nantucket Elementary School, Cyrus Peirce Middle School, and Nantucket High School.
Ownership History
Date
Name
Owned For
Owner Type
Purchase Details
Closed on
Apr 25, 2007
Sold by
Nettles James
Bought by
Nettles Ft and Stefanski
Current Estimated Value
Home Financials for this Owner
Home Financials are based on the most recent Mortgage that was taken out on this home.
Original Mortgage
$350,000
Outstanding Balance
$210,921
Interest Rate
6.18%
Mortgage Type
Purchase Money Mortgage
Estimated Equity
$4,415,153
Create a Home Valuation Report for This Property
The Home Valuation Report is an in-depth analysis detailing your home's value as well as a comparison with similar homes in the area
Home Values in the Area
Average Home Value in this Area
Purchase History
| Date | Buyer | Sale Price | Title Company |
|---|---|---|---|
| Nettles Ft | -- | -- | |
| Nettles Ft | -- | -- | |
| Nettles Ft | -- | -- |
Source: Public Records
Mortgage History
| Date | Status | Borrower | Loan Amount |
|---|---|---|---|
| Open | Nettles Ft | $350,000 | |
| Closed | Nettles Ft | $350,000 | |
| Previous Owner | Nettles Ft | $200,000 | |
| Previous Owner | Nettles Ft | $100,000 |
Source: Public Records
Tax History
| Year | Tax Paid | Tax Assessment Tax Assessment Total Assessment is a certain percentage of the fair market value that is determined by local assessors to be the total taxable value of land and additions on the property. | Land | Improvement |
|---|---|---|---|---|
| 2025 | $11,790 | $3,594,400 | $1,301,600 | $2,292,800 |
| 2024 | $11,094 | $3,544,300 | $1,251,500 | $2,292,800 |
| 2023 | $6,651 | $2,072,000 | $1,097,600 | $974,400 |
| 2022 | $5,910 | $1,580,300 | $838,400 | $741,900 |
| 2021 | $7,673 | $2,113,800 | $1,434,200 | $679,600 |
| 2020 | $7,293 | $2,113,800 | $1,434,200 | $679,600 |
| 2019 | $7,102 | $2,113,800 | $1,434,200 | $679,600 |
| 2018 | $7,486 | $2,120,700 | $1,434,200 | $686,500 |
| 2017 | $7,189 | $2,120,700 | $1,434,200 | $686,500 |
| 2016 | $6,989 | $2,080,100 | $1,434,200 | $645,900 |
| 2015 | $6,514 | $1,804,400 | $1,114,000 | $690,400 |
| 2014 | $6,277 | $1,669,400 | $1,114,000 | $555,400 |
Source: Public Records
Map
Nearby Homes
Your Personal Tour Guide
Ask me questions while you tour the home.