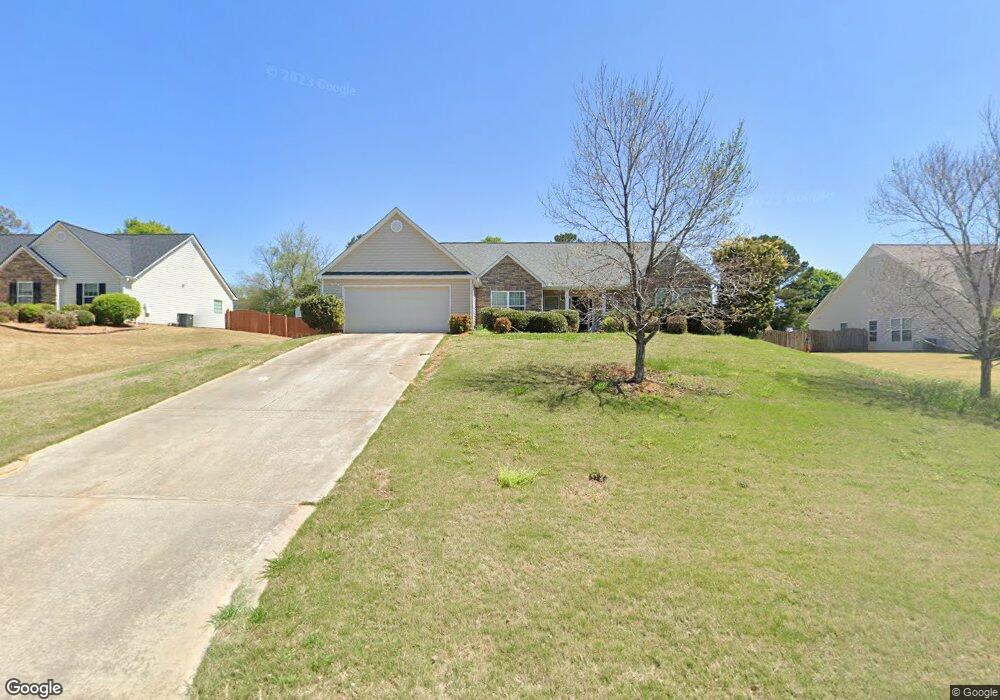
641 Sleeping Meadow Ln Bethlehem, GA 30620
Estimated Value: $316,000 - $346,000
3
Beds
2
Baths
1,653
Sq Ft
$199/Sq Ft
Est. Value
About This Home
This home is located at 641 Sleeping Meadow Ln, Bethlehem, GA 30620 and is currently estimated at $328,399, approximately $198 per square foot. 641 Sleeping Meadow Ln is a home located in Barrow County with nearby schools including Bethlehem Elementary School, Haymon-Morris Middle School, and Apalachee High School.
Ownership History
Date
Name
Owned For
Owner Type
Purchase Details
Closed on
Feb 18, 2011
Sold by
Federal Home Loan Mortgage Corporation
Bought by
Burnette Steven A
Current Estimated Value
Home Financials for this Owner
Home Financials are based on the most recent Mortgage that was taken out on this home.
Original Mortgage
$105,698
Outstanding Balance
$71,285
Interest Rate
4.71%
Mortgage Type
New Conventional
Estimated Equity
$257,114
Purchase Details
Closed on
Oct 5, 2010
Sold by
Ocwen Ln Servicing Llc
Bought by
Federal Home Loan Mortgage Corporation
Purchase Details
Closed on
Apr 22, 2005
Sold by
Meridian Hms Of Ga Inc
Bought by
Clark Sharon R
Home Financials for this Owner
Home Financials are based on the most recent Mortgage that was taken out on this home.
Original Mortgage
$111,400
Interest Rate
5.88%
Mortgage Type
New Conventional
Purchase Details
Closed on
Sep 17, 2003
Sold by
Millstone Development
Bought by
Meridian Homes Of Georgia Inc
Purchase Details
Closed on
Jan 3, 2001
Bought by
Millstone Development
Create a Home Valuation Report for This Property
The Home Valuation Report is an in-depth analysis detailing your home's value as well as a comparison with similar homes in the area
Home Values in the Area
Average Home Value in this Area
Purchase History
We collect this data history from publicly available records. To have your information removed, we recommend requesting removal directly through your county’s website.
| Date | Buyer | Sale Price | Title Company |
|---|---|---|---|
| Burnette Steven A | -- | -- | |
| Federal Home Loan Mortgage Corporation | -- | -- | |
| Ocwen Ln Servicing Llc | $108,000 | -- | |
| Clark Sharon R | $139,300 | -- | |
| Meridian Homes Of Georgia Inc | $2,409,000 | -- | |
| Millstone Development | -- | -- |
Source: Public Records
Mortgage History
We collect this data history from publicly available records. To have your information removed, we recommend requesting removal directly through your county’s website.
| Date | Status | Borrower | Loan Amount |
|---|---|---|---|
| Open | Burnette Steven A | $105,698 | |
| Previous Owner | Clark Sharon R | $111,400 | |
| Previous Owner | Clark Sharon R | $27,860 |
Source: Public Records
Tax History
| Year | Tax Paid | Tax Assessment Tax Assessment Total Assessment is a certain percentage of the fair market value that is determined by local assessors to be the total taxable value of land and additions on the property. | Land | Improvement |
|---|---|---|---|---|
| 2025 | $2,830 | $117,374 | $28,000 | $89,374 |
| 2024 | $2,825 | $114,747 | $28,000 | $86,747 |
| 2023 | $2,450 | $99,832 | $24,000 | $75,832 |
| 2022 | $2,241 | $78,378 | $24,000 | $54,378 |
| 2021 | $2,131 | $70,378 | $16,000 | $54,378 |
| 2020 | $2,009 | $66,060 | $16,000 | $50,060 |
| 2019 | $2,045 | $66,060 | $16,000 | $50,060 |
| 2018 | $1,855 | $60,542 | $14,800 | $45,742 |
| 2017 | $1,412 | $48,486 | $14,800 | $33,686 |
| 2016 | $1,491 | $48,860 | $14,800 | $34,060 |
| 2015 | $1,510 | $49,234 | $14,800 | $34,434 |
| 2014 | $1,349 | $42,452 | $7,644 | $34,808 |
| 2013 | -- | $40,739 | $7,644 | $33,095 |
Source: Public Records
Map
Nearby Homes
- 637 Sleeping Meadow Ln
- 650 Sleeping Meadow Ln
- 308 Meadows Dr
- 330 Meadows Dr
- 1505 Mill Creek Rd
- 253 Meadows Dr
- 293 Meadows Dr
- 189 Marie Ct
- 1029 Preserve Ln
- 649 Tanners Bridge Rd
- 925 Nature Trail Unit 2
- 441 Stillwater Dr Unit 1
- 236 Camp Ct
- 1007 Preserve Ln
- 1250 Persimmon Place Dr
- 1071 Covenant Ct
- 1408 Water Wheel Dr
- 312 Lokey's Ridge Rd
- 312 Lokeys Ridge Rd
- 1256 Loganville Hwy
- 639 Sleeping Meadow Ln
- 643 Sleeping Meadow Ln
- 637 Sleeping Meadow Ln Unit 1
- 645 Sleeping Meadow Ln
- 671 Sleeping Meadow Ln
- 642 Sleeping Meadow Ln Unit 34
- 642 Sleeping Meadow Ln
- 635 Sleeping Meadow Ln
- 647 Sleeping Meadow Ln
- 638 Sleeping Meadow Ln
- 636 Sleeping Meadow Ln
- 1406 Ellington Ct
- 1406 Ellington Ct Unit 1
- 633 Sleeping Meadow Ln
- 649 Sleeping Meadow Ln
- 634 Sleeping Meadow Ln
- 648 Sleeping Meadow Ln
- 1410 Ellington Ct
- 651 Sleeping Meadow Ln
- 632 Sleeping Meadow Ln
Your Personal Tour Guide
Ask me questions while you tour the home.