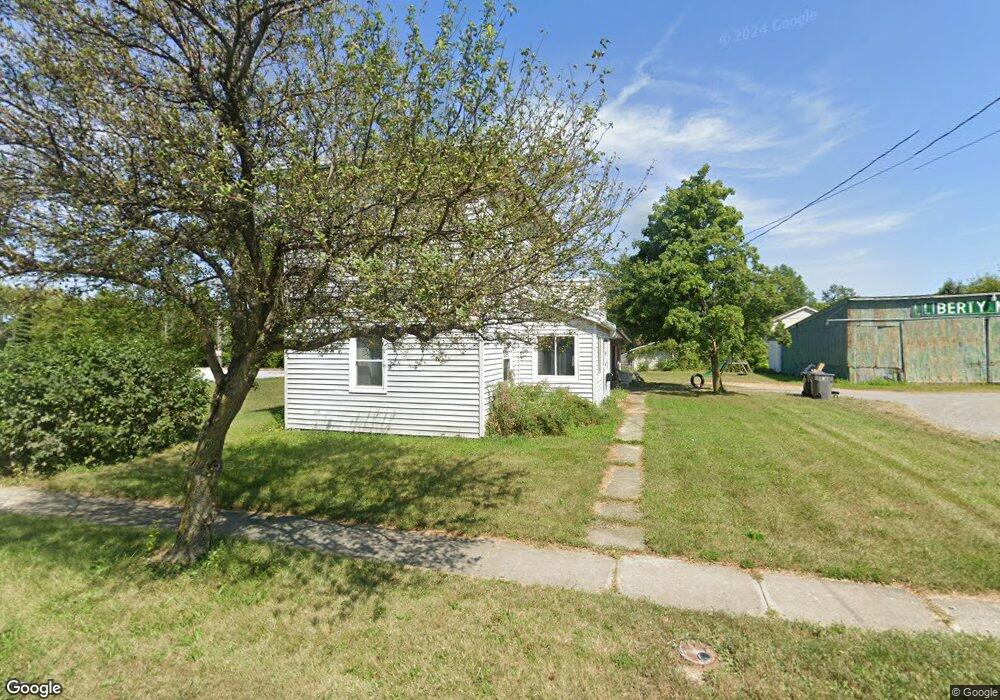
642 N Jackson St Lima, OH 45801
Eastside Lima NeighborhoodEstimated Value: $74,071 - $103,000
2
Beds
1
Bath
1,214
Sq Ft
$74/Sq Ft
Est. Value
About This Home
This home is located at 642 N Jackson St, Lima, OH 45801 and is currently estimated at $89,768, approximately $73 per square foot. 642 N Jackson St is a home located in Allen County with nearby schools including Independence Elementary School, Lima North Middle School, and Lima West Middle School.
Ownership History
Date
Name
Owned For
Owner Type
Purchase Details
Closed on
Jun 10, 2022
Bought by
Dewey M Augsburger
Current Estimated Value
Purchase Details
Closed on
Nov 10, 2017
Sold by
Augsburger Nelson and Augsburger Lacinda E
Bought by
Augsburger Nelson D and Augsburger Lacinda E
Purchase Details
Closed on
Aug 1, 1979
Bought by
Augsburger Neil D
Create a Home Valuation Report for This Property
The Home Valuation Report is an in-depth analysis detailing your home's value as well as a comparison with similar homes in the area
Home Values in the Area
Average Home Value in this Area
Purchase History
| Date | Buyer | Sale Price | Title Company |
|---|---|---|---|
| Dewey M Augsburger | -- | -- | |
| Augsburger Nelson D | -- | None Available | |
| Augsburger Neil D | -- | -- |
Source: Public Records
Tax History
| Year | Tax Paid | Tax Assessment Tax Assessment Total Assessment is a certain percentage of the fair market value that is determined by local assessors to be the total taxable value of land and additions on the property. | Land | Improvement |
|---|---|---|---|---|
| 2024 | $513 | $13,090 | $1,610 | $11,480 |
| 2023 | $553 | $12,460 | $1,540 | $10,920 |
| 2022 | $568 | $12,460 | $1,540 | $10,920 |
| 2021 | $586 | $12,460 | $1,540 | $10,920 |
| 2020 | $650 | $12,400 | $1,510 | $10,890 |
| 2019 | $650 | $12,400 | $1,510 | $10,890 |
| 2018 | $656 | $12,400 | $1,510 | $10,890 |
| 2017 | $668 | $12,400 | $1,510 | $10,890 |
| 2016 | $677 | $12,400 | $1,510 | $10,890 |
| 2015 | $642 | $12,400 | $1,510 | $10,890 |
| 2014 | $642 | $11,520 | $1,610 | $9,910 |
| 2013 | $626 | $11,520 | $1,610 | $9,910 |
Source: Public Records
Map
Nearby Homes
- 922 N Jefferson St
- 616-616.5 N Elizabeth St
- 735 N Elizabeth St
- 919 N Main St
- 316 Ewing Ave
- 129 S Pine St
- 416 Hazel Ave
- 145 S Pine St
- 325 N McDonel St
- 435 Marian Ave
- 406 Ewing Ave
- 626 E Elm St
- 631 Brice Ave
- 928 Burch Ave
- 934 N Metcalf St
- 431 N Metcalf St
- 1021 N McDonel St
- 217 Harrison Ave
- 610 Linden St
- 555 Haller St
- 628 N Jackson St
- 633 N Jefferson St
- 639 N Jefferson St
- 625 N Jefferson St
- 629 N Jefferson St
- 645 N Jefferson St
- 651 N Jefferson St
- 631 N Jefferson St
- 659 N Jefferson St
- 668 N Jackson St
- 621 N Jefferson St
- 661 N Jefferson St
- 663 N Jefferson St
- 617 N Jefferson St
- 670 N Jackson St
- 628 N Jefferson St
- 624 N Jefferson St
- 671 N Jefferson St
Your Personal Tour Guide
Ask me questions while you tour the home.