J
Seller's Agent in 2026
Jace Gordon
Luxury Group
(435) 705-4990
38 Total Sales
Estimated Value: $427,000 - $524,888
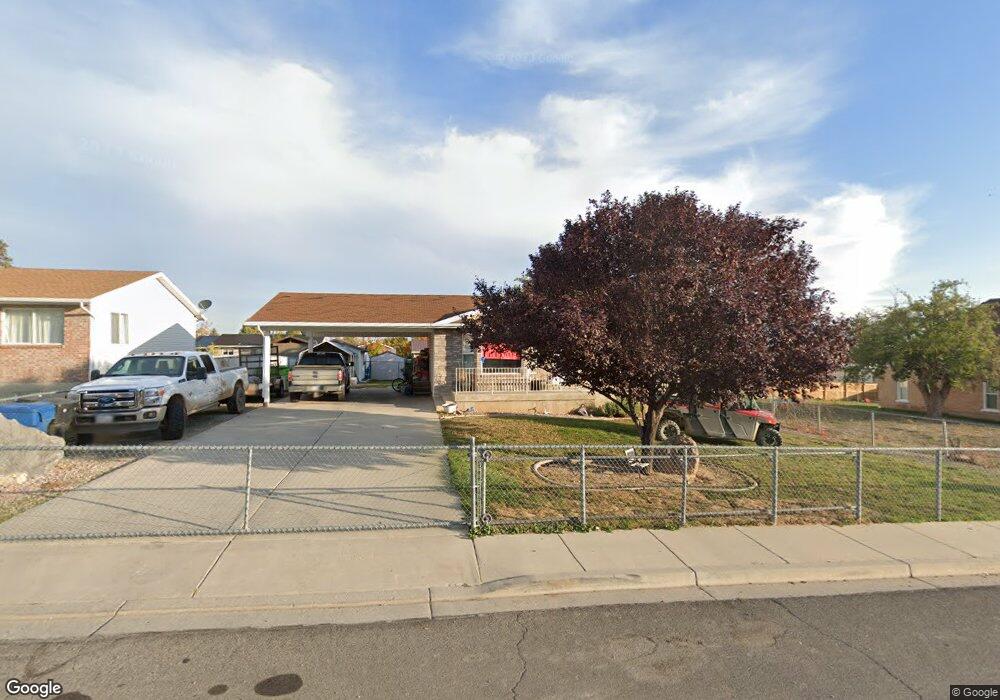
Beautifully renovated home with fully finished basement * New flooring, paint, cabinets, granite countertops, lighting, fixtures, doors, trim, and finishes throughout * New roof * New garage door * Big master closet and lots of storage throughout including cold storage * Fully fenced front and back yard * Large shed/workshop with built-in shelving in the backyard along with covered carport * Quiet neighborhood with beautiful mountain views * Located in the Salem Hills High School boundary *
We collect this data history from publicly available records. To have your information removed, we recommend requesting removal directly through your county’s website.
We collect this data history from publicly available records. To have your information removed, we recommend requesting removal directly through your county’s website.
| Date | Buyer | Sale Price | Title Company |
|---|---|---|---|
| -- | Gt Title Services | ||
| -- | Gt Title Services | ||
| -- | None Available | ||
| -- | -- | ||
| -- | Mountain West Title Co |
We collect this data history from publicly available records. To have your information removed, we recommend requesting removal directly through your county’s website.
| Date | Event | Price | List to Sale | Price per Sq Ft | Prior Sale |
|---|---|---|---|---|---|
| 07/01/2026 07/01/26 | Sold | -- | -- | -- | View Prior Sale |
| 06/01/2026 06/01/26 | Pending | -- | -- | -- | |
| 05/20/2026 05/20/26 | For Sale | $524,900 | -- | $249 / Sq Ft |
We collect this data history from publicly available records. To have your information removed, we recommend requesting removal directly through your county’s website.
| Year | Tax Paid | Tax Assessment Tax Assessment Total Assessment is a certain percentage of the fair market value that is determined by local assessors to be the total taxable value of land and additions on the property. | Land | Improvement |
|---|---|---|---|---|
| 2025 | $2,225 | $223,685 | -- | -- |
| 2024 | $1,984 | $201,960 | $0 | $0 |
| 2023 | $1,971 | $201,135 | $0 | $0 |
| 2022 | $2,057 | $206,470 | $0 | $0 |
| 2021 | $1,750 | $281,800 | $89,200 | $192,600 |
| 2020 | $1,660 | $261,400 | $81,100 | $180,300 |
| 2019 | $1,532 | $247,300 | $72,700 | $174,600 |
| 2018 | $1,403 | $218,400 | $64,900 | $153,500 |
| 2017 | $1,337 | $111,870 | $0 | $0 |
| 2016 | $1,211 | $100,705 | $0 | $0 |
| 2015 | $1,118 | $92,345 | $0 | $0 |
| 2014 | $994 | $82,665 | $0 | $0 |
J
Seller's Agent in 2026
Jace Gordon
Luxury Group
(435) 705-4990
38 Total Sales
T
Buyer's Agent in 2026
Ted Hartman
Equity Real Estate (Utah)
Ask me questions while you tour the home.
