T
Landlord's Agent in 2019
Tiffany Ross
RE/MAX
(775) 742-2331
3 Total Sales


Estimated Value: $215,000 - $237,000
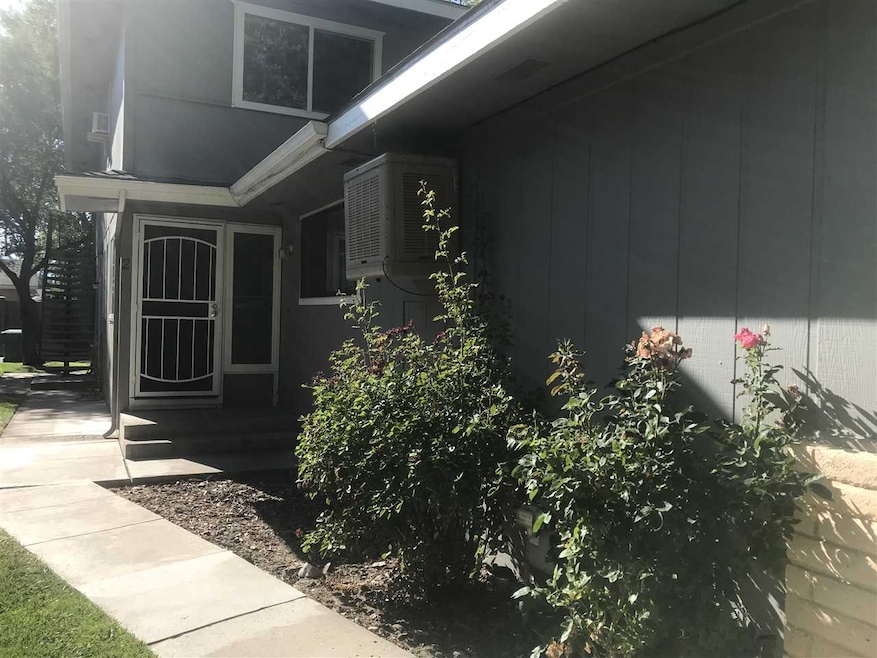
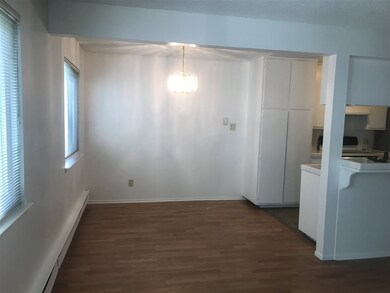
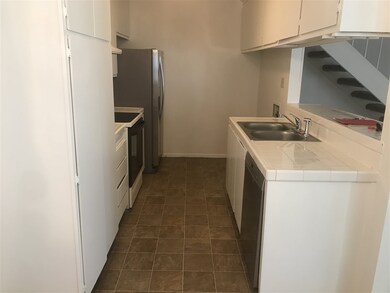
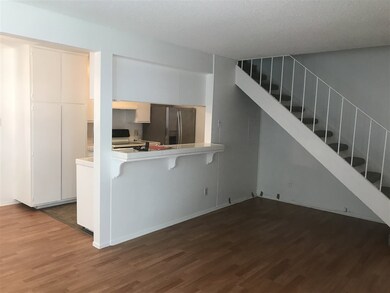
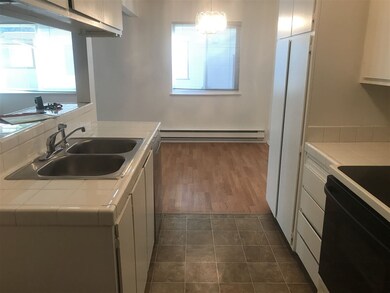
Move-in ready, 2 story condo in Sparks! Minutes from the Sparks Marina and shopping district. Freshly painted, new carpet and very clean. Condo has 2 bedrooms and 1 bath all upstairs. Refrigerator included. No AC. Owner pays HOA, Garbage and Sewer. Community Club House and Pool. Long term lease preferred. Small pet on approval only. Non-smoking. This condo will not last! Call to schedule showing today.
Last Agent to Rent the Property
RE/MAX Professionals-Reno License #S.170516 Listed on: 07/10/2019

Last Renter's Agent
Tiffany Ross
RE/MAX Gold-Midtown
| Date | Buyer | Sale Price | Title Company |
|---|---|---|---|
| Leonard Michael W | $98,500 | Ticor Title Reno | |
| Blazer Ronald | $60,000 | Ticor Title Reno |
| Date | Event | Price | List to Sale | Price per Sq Ft | Prior Sale |
|---|---|---|---|---|---|
| 07/22/2019 07/22/19 | Rented | $1,250 | 0.0% | -- | |
| 07/09/2019 07/09/19 | For Rent | $1,250 | 0.0% | -- | |
| 06/27/2013 06/27/13 | Sold | $60,000 | +6.2% | $68 / Sq Ft | View Prior Sale |
| 06/17/2013 06/17/13 | Pending | -- | -- | -- | |
| 06/10/2013 06/10/13 | For Sale | $56,500 | -- | $64 / Sq Ft |
| Year | Tax Paid | Tax Assessment Tax Assessment Total Assessment is a certain percentage of the fair market value that is determined by local assessors to be the total taxable value of land and additions on the property. | Land | Improvement |
|---|---|---|---|---|
| 2026 | $365 | $31,386 | $20,160 | $11,226 |
| 2024 | $474 | $27,986 | $16,940 | $11,046 |
| 2023 | $459 | $27,100 | $17,570 | $9,531 |
| 2022 | $447 | $21,007 | $12,950 | $8,057 |
| 2021 | $434 | $18,523 | $10,150 | $8,373 |
| 2020 | $419 | $18,884 | $10,150 | $8,734 |
| 2019 | $407 | $17,756 | $8,855 | $8,901 |
| 2018 | $395 | $14,198 | $5,285 | $8,913 |
| 2017 | $384 | $13,740 | $4,620 | $9,120 |
| 2016 | $375 | $13,186 | $3,640 | $9,546 |
| 2015 | $374 | $13,375 | $3,430 | $9,945 |
| 2014 | $363 | $12,305 | $2,590 | $9,715 |
| 2013 | -- | $9,649 | $1,715 | $7,934 |
T
Landlord's Agent in 2019
Tiffany Ross
RE/MAX
(775) 742-2331
3 Total Sales
Seller's Agent in 2013
Kim Delancey
Ferrari-Lund Real Estate Reno
(775) 691-6597
43 Total Sales
Buyer's Agent in 2013
Jay-Dee Brehm
Hello Real Estate Center
(775) 622-6688
15 Total Sales
J
Buyer's Agent in 2013
Jay-Dee Woolf
Dickson Realty
Source: Northern Nevada Regional MLS
MLS Number: 190010428
APN: 033-322-64
Disclaimer: Certain information contained herein is derived from information provided by parties other than Homes.com. All information provided is deemed reliable, but is not guaranteed to be accurate and should be independently verified.
![]() IDX information is provided exclusively for personal, non-commercial use, and may not be used for any purpose other than to identify prospective properties consumers may be interested in purchasing. Information is deemed reliable but not guaranteed. The content relating to real estate for sale on this web site comes in part from the Broker Reciprocity/ IDX program of the Northern Nevada Regional Multiple Listing Service°. Real estate listings held by brokerage firms other than Ten-X are marked with the Broker Reciprocity logo and detailed information about those listings includes the name of the listing brokerage. Any use of the content other than by a search performed by a consumer looking to purchase or rent real estate is prohibited. © 2026 Northern Nevada Regional Multiple Listing Service® MLS. All rights reserved.
IDX information is provided exclusively for personal, non-commercial use, and may not be used for any purpose other than to identify prospective properties consumers may be interested in purchasing. Information is deemed reliable but not guaranteed. The content relating to real estate for sale on this web site comes in part from the Broker Reciprocity/ IDX program of the Northern Nevada Regional Multiple Listing Service°. Real estate listings held by brokerage firms other than Ten-X are marked with the Broker Reciprocity logo and detailed information about those listings includes the name of the listing brokerage. Any use of the content other than by a search performed by a consumer looking to purchase or rent real estate is prohibited. © 2026 Northern Nevada Regional Multiple Listing Service® MLS. All rights reserved.
Ask me questions while you tour the home.