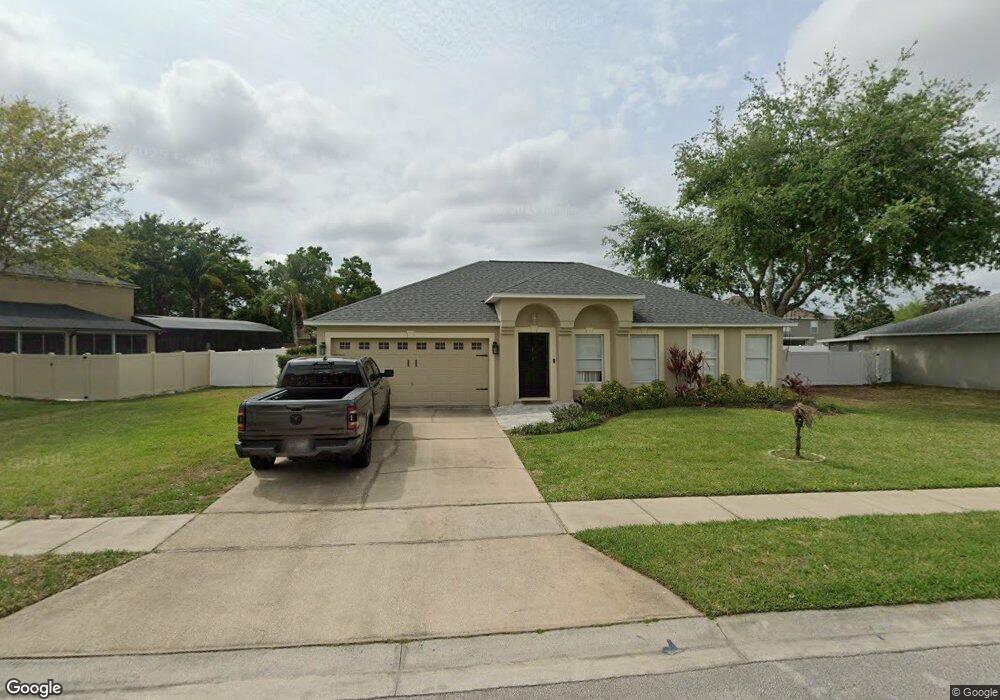
644 Red Pepper Loop Chuluota, FL 32766
Estimated Value: $489,484 - $517,000
4
Beds
2
Baths
2,088
Sq Ft
$240/Sq Ft
Est. Value
About This Home
This home is located at 644 Red Pepper Loop, Chuluota, FL 32766 and is currently estimated at $501,121, approximately $240 per square foot. 644 Red Pepper Loop is a home located in Seminole County with nearby schools including Walker Elementary School, Lawton Chiles Middle School, and Hagerty High School.
Ownership History
Date
Name
Owned For
Owner Type
Purchase Details
Closed on
Dec 22, 2016
Sold by
Fannie Mae
Bought by
Arrieta Sean T and Depreta Amanda K
Current Estimated Value
Home Financials for this Owner
Home Financials are based on the most recent Mortgage that was taken out on this home.
Original Mortgage
$265,109
Outstanding Balance
$213,909
Interest Rate
3.75%
Mortgage Type
FHA
Estimated Equity
$287,212
Purchase Details
Closed on
Jun 15, 2016
Sold by
Strickland Steven J and Strickland Michele L
Bought by
Federal National Mortgage Association
Purchase Details
Closed on
Jan 30, 2004
Sold by
Maronda Homes Inc Of Florida
Bought by
Strickland Steven J and Strickland Michele L
Home Financials for this Owner
Home Financials are based on the most recent Mortgage that was taken out on this home.
Original Mortgage
$36,000
Interest Rate
5.77%
Mortgage Type
Credit Line Revolving
Create a Home Valuation Report for This Property
The Home Valuation Report is an in-depth analysis detailing your home's value as well as a comparison with similar homes in the area
Home Values in the Area
Average Home Value in this Area
Purchase History
We collect this data history from publicly available records. To have your information removed, we recommend requesting removal directly through your county’s website.
| Date | Buyer | Sale Price | Title Company |
|---|---|---|---|
| Arrieta Sean T | $270,000 | Reo Title Company Of Florida | |
| Federal National Mortgage Association | $302,100 | None Available | |
| Strickland Steven J | $180,000 | Kampf Title & Guaranty Corpo |
Source: Public Records
Mortgage History
We collect this data history from publicly available records. To have your information removed, we recommend requesting removal directly through your county’s website.
| Date | Status | Borrower | Loan Amount |
|---|---|---|---|
| Open | Arrieta Sean T | $265,109 | |
| Previous Owner | Strickland Steven J | $36,000 | |
| Previous Owner | Strickland Steven J | $144,000 |
Source: Public Records
Tax History
| Year | Tax Paid | Tax Assessment Tax Assessment Total Assessment is a certain percentage of the fair market value that is determined by local assessors to be the total taxable value of land and additions on the property. | Land | Improvement |
|---|---|---|---|---|
| 2025 | $3,395 | $258,335 | -- | -- |
| 2024 | $3,158 | $251,054 | -- | -- |
| 2023 | $3,083 | $243,742 | $0 | $0 |
| 2021 | $2,930 | $229,750 | $0 | $0 |
| 2020 | $2,905 | $226,578 | $0 | $0 |
| 2019 | $2,881 | $221,484 | $0 | $0 |
| 2018 | $2,849 | $217,354 | $0 | $0 |
| 2017 | $2,831 | $212,883 | $0 | $0 |
| 2016 | $2,046 | $208,289 | $0 | $0 |
| 2015 | $1,768 | $152,819 | $0 | $0 |
| 2014 | $1,768 | $151,606 | $0 | $0 |
Source: Public Records
Map
Nearby Homes
- 673 Red Pepper Loop
- 539 Granite Cir
- 467 Granite Cir
- 307 Velveteen Place
- 796 Mills Estate Place
- 773 Mills Estate Place
- 358 Knot Hole Cir
- 503 Osprey Lakes Cir
- 251 Avenue E
- 301 Kiwanis Cir
- 307 Knot Hole Cir
- 3018 Kingfisher Point
- 100 Festive Ct
- 834 Millshore Dr
- 0 Stevens Ave
- 0 Sumner Ave Unit MFRO6365350
- 440 Lake Lenelle Dr
- 116 W 5th St
- 0 W 5th St
- 142 E 11th St
- 648 Red Pepper Loop Unit 1
- 640 Red Pepper Loop
- 559 Nutmeg Ct Unit 1
- 645 Red Pepper Loop Unit 1
- 567 Nutmeg Ct Unit 1
- 656 Red Pepper Loop
- 649 Red Pepper Loop
- 632 Red Pepper Loop
- 641 Red Pepper Loop
- 637 Red Pepper Loop Unit 1
- 653 Red Pepper Loop
- 571 Nutmeg Ct Unit 1
- 633 Red Pepper Loop
- 555 Nutmeg Ct Unit 1
- 628 Red Pepper Loop
- 562 Nutmeg Ct
- 657 Red Pepper Loop
- 664 Red Pepper Loop Unit 1
- 629 Red Pepper Loop
- 575 Nutmeg Ct
Your Personal Tour Guide
Ask me questions while you tour the home.