6473 E Meyer Dr Morrow, GA 30260
Morrow AreaEstimated Value: $251,620 - $319,000
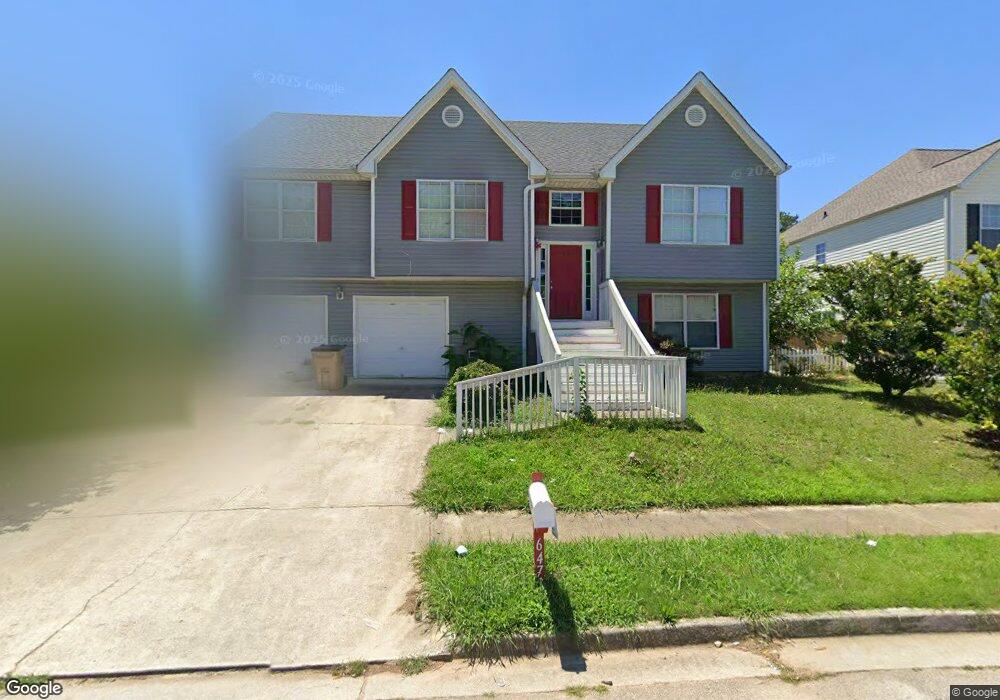
About This Home
Please note, our homes are available on a first-come, first-serve basis and are not reserved until the lease is signed by all applicants and security deposits are collected.
This home features Progress Smart Home - Progress Residential's smart home app, which allows you to control the home securely from any of your devices. Learn more at
Want to tour on your own? Click the “Self Tour” button on this home’s listing or call to register for a self-guided showing at a time that works best for you.
Interested in this home? You clearly have exceptional taste. This charming 4.0-bedroom, 3.0-bathroom home is not only pet-friendly, but also equipped with smart home features to make everyday life more convenient and connected. Homes like this don’t stay on the market for long—don’t miss your chance to make it yours. Apply today!
Some images have been virtually staged to help showcase the potential of spaces in the home. The furnishings shown are for illustrative purposes only and are not included in the home.
Ownership History
We collect this data history from publicly available records. To have your information removed, we recommend requesting removal directly through your county’s website.
Purchase Details
Purchase Details
Purchase Details
Purchase Details
Purchase Details
Home Values in the Area
Average Home Value in this Area
Purchase History
We collect this data history from publicly available records. To have your information removed, we recommend requesting removal directly through your county’s website.
| Date | Buyer | Sale Price | Title Company |
|---|---|---|---|
| -- | -- | ||
| -- | -- | ||
| $163,000 | -- | ||
| $50,000 | -- | ||
| -- | -- | ||
| $73,600 | -- |
Mortgage History
We collect this data history from publicly available records. To have your information removed, we recommend requesting removal directly through your county’s website.
| Date | Status | Borrower | Loan Amount |
|---|---|---|---|
| Previous Owner | $31,480 | ||
| Previous Owner | $125,920 |
Property History
We collect this data history from publicly available records. To have your information removed, we recommend requesting removal directly through your county’s website.
| Date | Event | Price | List to Sale | Price per Sq Ft |
|---|---|---|---|---|
| 02/13/2026 02/13/26 | Off Market | $2,480 | -- | -- |
| 02/07/2026 02/07/26 | Price Changed | $2,480 | +0.2% | $1 / Sq Ft |
| 02/05/2026 02/05/26 | Price Changed | $2,475 | -2.9% | $1 / Sq Ft |
| 01/31/2026 01/31/26 | Price Changed | $2,550 | +2.0% | $1 / Sq Ft |
| 01/29/2026 01/29/26 | Price Changed | $2,500 | 0.0% | $1 / Sq Ft |
| 01/29/2026 01/29/26 | For Rent | $2,500 | +1.0% | -- |
| 06/01/2025 06/01/25 | Off Market | $2,475 | -- | -- |
| 05/22/2025 05/22/25 | Price Changed | $2,475 | +0.2% | $1 / Sq Ft |
| 05/20/2025 05/20/25 | Price Changed | $2,470 | -1.0% | $1 / Sq Ft |
| 05/19/2025 05/19/25 | Price Changed | $2,495 | -0.2% | $1 / Sq Ft |
| 05/16/2025 05/16/25 | Price Changed | $2,500 | -0.2% | $1 / Sq Ft |
| 05/15/2025 05/15/25 | Price Changed | $2,505 | -0.2% | $1 / Sq Ft |
| 05/15/2025 05/15/25 | Price Changed | $2,510 | +0.2% | $1 / Sq Ft |
| 05/12/2025 05/12/25 | Price Changed | $2,505 | -0.2% | $1 / Sq Ft |
| 05/11/2025 05/11/25 | Price Changed | $2,510 | +1.4% | $1 / Sq Ft |
| 05/08/2025 05/08/25 | Price Changed | $2,475 | -0.8% | $1 / Sq Ft |
| 05/07/2025 05/07/25 | Price Changed | $2,495 | -0.2% | $1 / Sq Ft |
| 05/01/2025 05/01/25 | Price Changed | $2,500 | -0.4% | $1 / Sq Ft |
| 04/30/2025 04/30/25 | Price Changed | $2,510 | +0.2% | $1 / Sq Ft |
| 04/29/2025 04/29/25 | Price Changed | $2,505 | +0.2% | $1 / Sq Ft |
| 04/27/2025 04/27/25 | Price Changed | $2,500 | -0.6% | $1 / Sq Ft |
| 04/24/2025 04/24/25 | Price Changed | $2,515 | +2.2% | $1 / Sq Ft |
| 04/23/2025 04/23/25 | Price Changed | $2,460 | -0.2% | $1 / Sq Ft |
| 04/22/2025 04/22/25 | Price Changed | $2,465 | -0.2% | $1 / Sq Ft |
| 04/22/2025 04/22/25 | Price Changed | $2,470 | -1.0% | $1 / Sq Ft |
| 04/20/2025 04/20/25 | Price Changed | $2,495 | -0.4% | $1 / Sq Ft |
| 04/15/2025 04/15/25 | Price Changed | $2,505 | +1.8% | $1 / Sq Ft |
| 04/12/2025 04/12/25 | Price Changed | $2,460 | +2.3% | $1 / Sq Ft |
| 04/11/2025 04/11/25 | Price Changed | $2,405 | +1.9% | $1 / Sq Ft |
| 03/20/2025 03/20/25 | Price Changed | $2,360 | -28.7% | $1 / Sq Ft |
| 03/18/2025 03/18/25 | For Rent | $3,310 | -- | -- |
Tax History
We collect this data history from publicly available records. To have your information removed, we recommend requesting removal directly through your county’s website.
| Year | Tax Paid | Tax Assessment Tax Assessment Total Assessment is a certain percentage of the fair market value that is determined by local assessors to be the total taxable value of land and additions on the property. | Land | Improvement |
|---|---|---|---|---|
| 2025 | $3,906 | $100,997 | $9,090 | $91,907 |
| 2024 | $3,185 | $104,120 | $9,600 | $94,520 |
| 2023 | $2,951 | $80,680 | $9,600 | $71,080 |
| 2022 | $3,008 | $75,680 | $9,600 | $66,080 |
| 2021 | $2,613 | $65,200 | $8,880 | $56,320 |
| 2020 | $2,358 | $58,013 | $9,600 | $48,413 |
| 2019 | $1,688 | $40,634 | $9,600 | $31,034 |
| 2018 | $1,738 | $41,870 | $9,600 | $32,270 |
| 2017 | $1,277 | $30,445 | $9,600 | $20,845 |
| 2016 | $1,286 | $30,662 | $9,600 | $21,062 |
| 2015 | $1,265 | $0 | $0 | $0 |
| 2014 | $1,213 | $29,546 | $9,600 | $19,946 |
Map
- 6472 W Meyer Ct
- 2750 Mill Lake Way
- 6584 Sleepy Hollow Ln
- 6572 Sleepy Hollow Ln
- 6367 Monica Dr
- 6408 Veracruse Dr
- 6278 Mount Zion Blvd
- 2845 Heritage Ln
- 6378 Veracruse Dr
- 2794 Lake Harbin Rd
- 6464 Rabun Rd
- 2676 Lilac Dr
- 2497 Celina Ct
- 6485 Menlo Way
- 2688 Heritage Ln
- 2688 Heritage Ln
- 6367 Warber Ct
- 6359 Warbler Ct
- 2921 Lake Harbin Rd
- 6195 Green Wing Way
- 6474 E Meyer Dr
- 6480 E Meyer Dr
- 6468 E Meyer Dr
- 6462 E Meyer Dr
- 6486 E Meyer Dr
- 6469 Pine Bark Ct
- 6475 Pine Bark Ct Unit 2
- 6456 E Meyer Dr
- 6479 E Meyer Dr
- 6492 E Meyer Dr
- 6459 Pine Bark Ct
- 6481 Pine Bark Ct
- E E Meyer Dr
- 6467 E Meyer Dr
- 6450 E Meyer Dr
- 6481 E Meyer Dr
- 6487 Pine Bark Ct Unit 2
- 6455 Pine Bark Ct
- 6463 E Meyer Dr
- 6444 E Meyer Dr
Ask me questions while you tour the home.