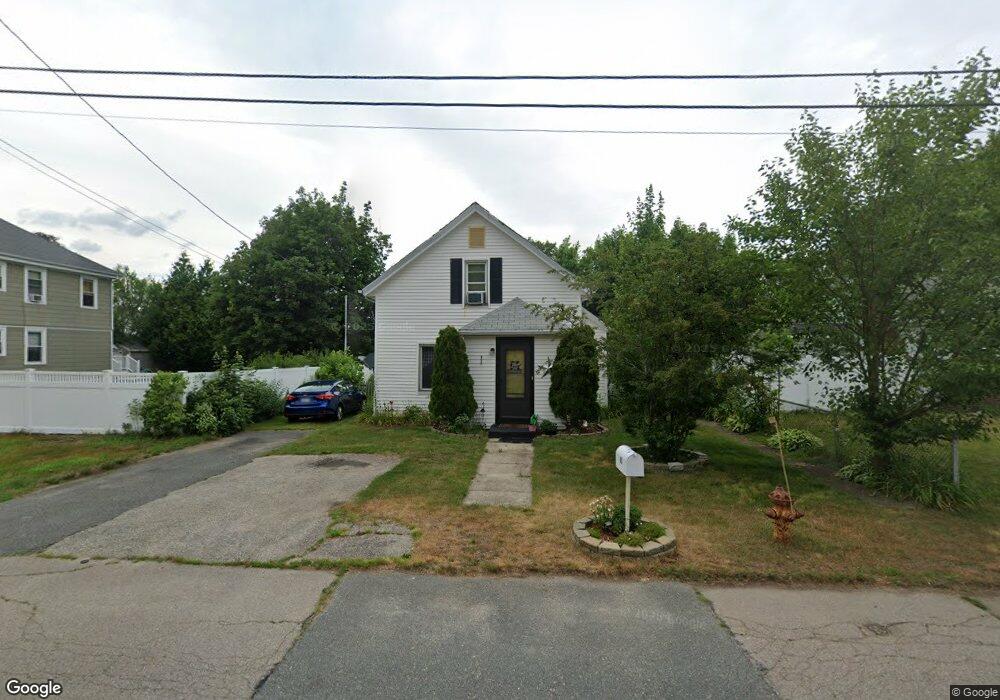
65 Bacon St Attleboro, MA 02703
Estimated Value: $377,000 - $456,000
3
Beds
2
Baths
1,140
Sq Ft
$361/Sq Ft
Est. Value
About This Home
This home is located at 65 Bacon St, Attleboro, MA 02703 and is currently estimated at $411,473, approximately $360 per square foot. 65 Bacon St is a home located in Bristol County with nearby schools including Hill-Roberts Elementary School, Robert J. Coelho Middle School, and Attleboro High School.
Ownership History
Date
Name
Owned For
Owner Type
Purchase Details
Closed on
Oct 24, 2003
Sold by
Trombley Bruce G and Trombley Bonnie L
Bought by
Trombley Bruce G
Current Estimated Value
Purchase Details
Closed on
Jul 1, 1996
Sold by
Pedro Robert J
Bought by
Trombley Bruce G and Trombley Bonnie L
Home Financials for this Owner
Home Financials are based on the most recent Mortgage that was taken out on this home.
Original Mortgage
$104,958
Interest Rate
8.05%
Mortgage Type
Purchase Money Mortgage
Purchase Details
Closed on
Apr 3, 1996
Sold by
Kiosk Prop
Bought by
Pedro Robert J
Home Financials for this Owner
Home Financials are based on the most recent Mortgage that was taken out on this home.
Original Mortgage
$39,000
Interest Rate
7.31%
Mortgage Type
Purchase Money Mortgage
Purchase Details
Closed on
Sep 15, 1995
Sold by
Bays Tommy R and Bays Mhfa
Bought by
Kiosk Prop Inc
Create a Home Valuation Report for This Property
The Home Valuation Report is an in-depth analysis detailing your home's value as well as a comparison with similar homes in the area
Home Values in the Area
Average Home Value in this Area
Purchase History
We collect this data history from publicly available records. To have your information removed, we recommend requesting removal directly through your county’s website.
| Date | Buyer | Sale Price | Title Company |
|---|---|---|---|
| Trombley Bruce G | -- | -- | |
| Trombley Bruce G | $102,900 | -- | |
| Pedro Robert J | $60,000 | -- | |
| Kiosk Prop Inc | $56,600 | -- |
Source: Public Records
Mortgage History
We collect this data history from publicly available records. To have your information removed, we recommend requesting removal directly through your county’s website.
| Date | Status | Borrower | Loan Amount |
|---|---|---|---|
| Previous Owner | Kiosk Prop Inc | $104,958 | |
| Previous Owner | Kiosk Prop Inc | $39,000 |
Source: Public Records
Tax History
| Year | Tax Paid | Tax Assessment Tax Assessment Total Assessment is a certain percentage of the fair market value that is determined by local assessors to be the total taxable value of land and additions on the property. | Land | Improvement |
|---|---|---|---|---|
| 2025 | $3,765 | $300,000 | $129,500 | $170,500 |
| 2024 | $3,781 | $297,000 | $129,500 | $167,500 |
| 2023 | $3,632 | $265,300 | $117,700 | $147,600 |
| 2022 | $3,526 | $244,000 | $112,100 | $131,900 |
| 2021 | $5,019 | $219,800 | $107,800 | $112,000 |
| 2020 | $3,186 | $218,800 | $104,700 | $114,100 |
| 2019 | $2,972 | $209,900 | $102,700 | $107,200 |
| 2018 | $2,825 | $190,600 | $99,700 | $90,900 |
| 2017 | $2,797 | $192,200 | $99,700 | $92,500 |
| 2016 | $2,622 | $176,900 | $97,900 | $79,000 |
| 2015 | $2,411 | $163,900 | $97,900 | $66,000 |
| 2014 | $2,337 | $157,400 | $93,200 | $64,200 |
Source: Public Records
Map
Nearby Homes
- 136 Collins St
- 179 Columbine Ave
- 27 Collins Ave
- 56 Baltic St Unit 56
- 215 Kenyon Ave
- 82 Webster St
- 0 Lodi St
- 362 Kenyon Ave
- 72 Julian St
- 39 Webster St Unit 101
- 34 Appleton Ave
- 208 Sabin St
- 310 Mendon Rd
- 82 Pine Rd
- 9 Romoli Ave Unit 9
- 63 W Carpenter St
- 25 Mowry St
- 46 Lilac St
- 39 Chaplin St
- 548 Kenyon Ave Unit 42
Your Personal Tour Guide
Ask me questions while you tour the home.