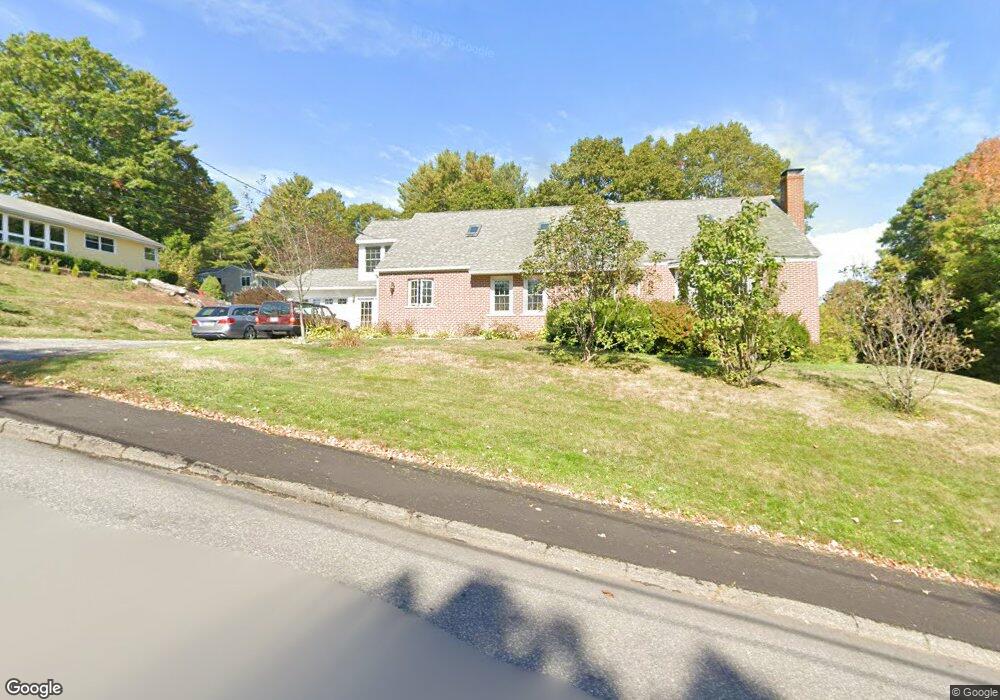
65 Central St Hallowell, ME 04347
Estimated Value: $480,000 - $532,364
About This Home
This home is located at 65 Central St, Hallowell, ME 04347 and is currently estimated at $507,341, approximately $203 per square foot. 65 Central St is a home located in Kennebec County with nearby schools including Dresden Elementary School, Marcia Buker School, and Monmouth Memorial School.
Ownership History
We collect this data history from publicly available records. To have your information removed, we recommend requesting removal directly through your county’s website.
Purchase Details
Purchase Details
Home Financials for this Owner
Home Financials are based on the most recent Mortgage that was taken out on this home.Purchase Details
Home Values in the Area
Average Home Value in this Area
Purchase History
We collect this data history from publicly available records. To have your information removed, we recommend requesting removal directly through your county’s website.
| Date | Buyer | Sale Price | Title Company |
|---|---|---|---|
| -- | None Available | ||
| -- | -- | ||
| -- | -- |
Mortgage History
We collect this data history from publicly available records. To have your information removed, we recommend requesting removal directly through your county’s website.
| Date | Status | Borrower | Loan Amount |
|---|---|---|---|
| Previous Owner | $172,000 |
Tax History
We collect this data history from publicly available records. To have your information removed, we recommend requesting removal directly through your county’s website.
| Year | Tax Paid | Tax Assessment Tax Assessment Total Assessment is a certain percentage of the fair market value that is determined by local assessors to be the total taxable value of land and additions on the property. | Land | Improvement |
|---|---|---|---|---|
| 2025 | $6,015 | $314,900 | $79,400 | $235,500 |
| 2024 | $6,267 | $314,900 | $79,400 | $235,500 |
| 2023 | $5,281 | $229,100 | $57,800 | $171,300 |
| 2022 | $5,086 | $229,100 | $57,800 | $171,300 |
| 2021 | $4,880 | $229,100 | $57,800 | $171,300 |
| 2020 | $4,876 | $226,800 | $55,500 | $171,300 |
| 2019 | $4,831 | $226,800 | $55,500 | $171,300 |
| 2018 | $4,468 | $226,800 | $55,500 | $171,300 |
| 2017 | $4,480 | $227,400 | $55,500 | $171,900 |
| 2016 | $4,298 | $227,400 | $55,500 | $171,900 |
| 2015 | $4,002 | $227,400 | $55,500 | $171,900 |
| 2014 | $3,937 | $223,700 | $55,500 | $168,200 |
| 2013 | $3,825 | $223,700 | $55,500 | $168,200 |
Map
- 2 Warren St
- 7 Spring St
- 15 Middle St Unit 3
- 0 Winthrop Street Map 6 Lot 15
- 19 Union St
- 93 Central St
- 17 Union St
- 19 Hillcrest St
- 89 Water St Unit 2
- 9 Summer St
- 10 Summer St
- 74 Second St Unit A
- 74 2nd St Unit 1
- Lot 20 Acorn Ln Unit 20
- Lot 23 Acorn Ln Unit 23
- Lot 21 Acorn Ln Unit 21
- 85 Middle St Unit 10
- 85 Middle St Unit 7
- Lot 9 Overlook Dr
- 1 Bridge St
Ask me questions while you tour the home.