65 E Glen Dr Westfield, MA 01085
Westfield AreaEstimated Value: $472,000 - $493,000
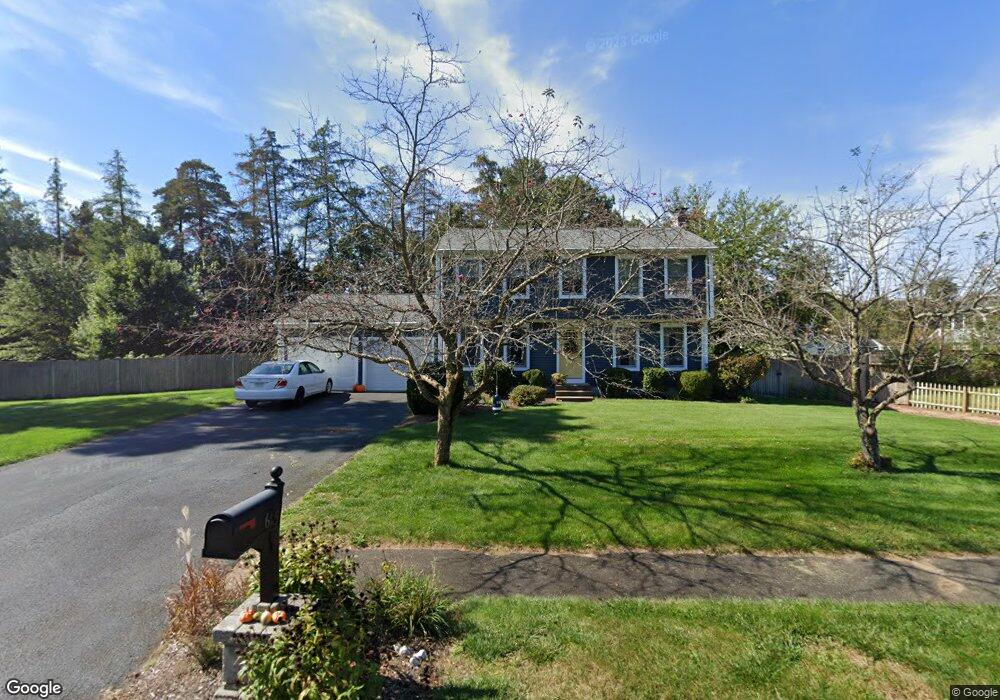
About This Home
This home is located at 65 E Glen Dr, Westfield, MA 01085 and is currently estimated at $478,474, approximately $281 per square foot. 65 E Glen Dr is a home located in Hampden County with nearby schools including Westfield High School, White Oak School, and Westfield Christian Academy.
Ownership History
We collect this data history from publicly available records. To have your information removed, we recommend requesting removal directly through your county’s website.
Purchase Details
Home Values in the Area
Average Home Value in this Area
Purchase History
We collect this data history from publicly available records. To have your information removed, we recommend requesting removal directly through your county’s website.
| Date | Buyer | Sale Price | Title Company |
|---|---|---|---|
| $146,000 | -- |
Mortgage History
We collect this data history from publicly available records. To have your information removed, we recommend requesting removal directly through your county’s website.
| Date | Status | Borrower | Loan Amount |
|---|---|---|---|
| Closed | $812,253 | ||
| Closed | $60,000 | ||
| Closed | $29,150 | ||
| Closed | $131,000 |
Tax History
We collect this data history from publicly available records. To have your information removed, we recommend requesting removal directly through your county’s website.
| Year | Tax Paid | Tax Assessment Tax Assessment Total Assessment is a certain percentage of the fair market value that is determined by local assessors to be the total taxable value of land and additions on the property. | Land | Improvement |
|---|---|---|---|---|
| 2025 | $5,718 | $376,700 | $118,200 | $258,500 |
| 2024 | $5,732 | $358,900 | $107,300 | $251,600 |
| 2023 | $5,632 | $331,700 | $102,300 | $229,400 |
| 2022 | $5,449 | $294,700 | $91,500 | $203,200 |
| 2021 | $5,281 | $279,700 | $86,000 | $193,700 |
| 2020 | $5,194 | $269,800 | $86,000 | $183,800 |
| 2019 | $5,083 | $258,400 | $81,900 | $176,500 |
| 2018 | $5,003 | $258,400 | $81,900 | $176,500 |
| 2017 | $4,902 | $252,400 | $83,200 | $169,200 |
| 2016 | $4,907 | $252,400 | $83,200 | $169,200 |
| 2015 | $4,568 | $246,400 | $83,200 | $163,200 |
| 2014 | $3,418 | $246,400 | $83,200 | $163,200 |
Map
- 38 Klondike Ave
- 37 Klondike Ave
- 67 Woodside Terrace
- 8 Emerald Ave
- 164 Barbara St
- 868 Southampton Rd Unit 43
- 110 Lockhouse Rd Unit I
- 19 Arch Rd
- 94 Holyoke Rd
- Lot 2 Nathaniel Hill
- 9 Johns Dr
- 25 Williams Way
- 35 Pinehurst St
- 11 Carol Cir
- 0 Char Dr
- 21 4th Ave
- 289 Lower Sandyhill Rd
- 5 4th Ave
- 71 Notre Dame St
- 11 Furrow St
Ask me questions while you tour the home.