65 E Main St Westborough, MA 01581
Estimated Value: $1,817,924
About This Home
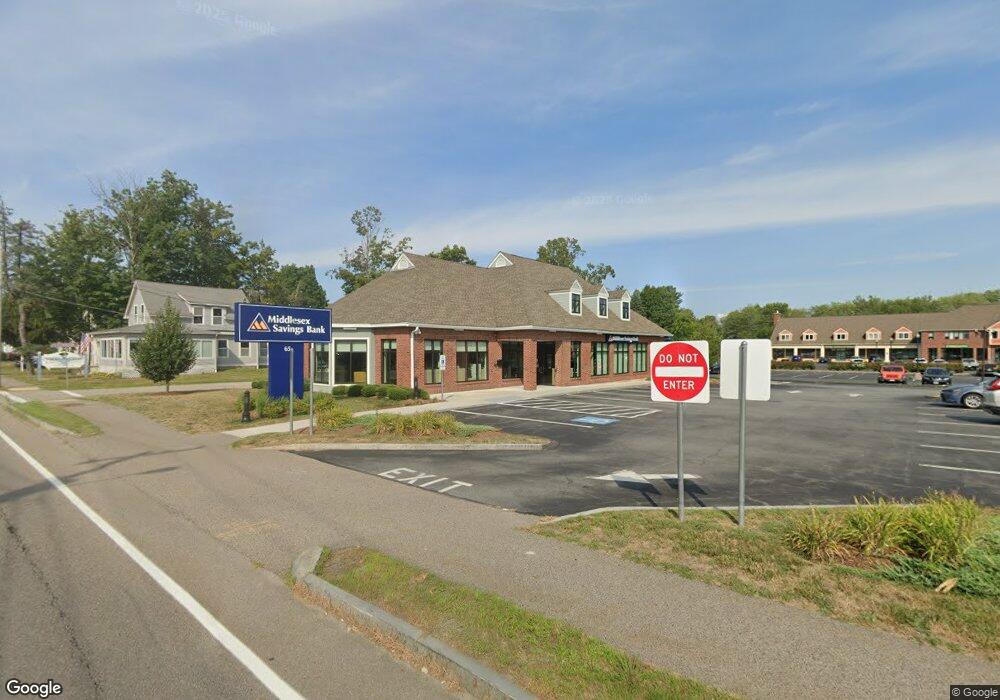
This home is located at 65 E Main St, Westborough, MA 01581 and is currently estimated at $1,817,924, approximately $403 per square foot. 65 E Main St is a home located in Worcester County with nearby schools including Westborough High School, Ebridge Montessori School, and Westboro Knowledge Beginnings.
Ownership History
We collect this data history from publicly available records. To have your information removed, we recommend requesting removal directly through your county’s website.
Purchase Details
Purchase Details
Home Financials for this Owner
Home Financials are based on the most recent Mortgage that was taken out on this home.Home Values in the Area
Average Home Value in this Area
Purchase History
We collect this data history from publicly available records. To have your information removed, we recommend requesting removal directly through your county’s website.
| Date | Buyer | Sale Price | Title Company |
|---|---|---|---|
| -- | None Available | ||
| $460,000 | -- | ||
| $460,000 | -- |
Mortgage History
We collect this data history from publicly available records. To have your information removed, we recommend requesting removal directly through your county’s website.
| Date | Status | Borrower | Loan Amount |
|---|---|---|---|
| Previous Owner | $150,000 | ||
| Previous Owner | $230,000 | ||
| Closed | $184,000 |
Tax History
We collect this data history from publicly available records. To have your information removed, we recommend requesting removal directly through your county’s website.
| Year | Tax Paid | Tax Assessment Tax Assessment Total Assessment is a certain percentage of the fair market value that is determined by local assessors to be the total taxable value of land and additions on the property. | Land | Improvement |
|---|---|---|---|---|
| 2025 | $18,843 | $1,156,700 | $279,200 | $877,500 |
| 2024 | $16,888 | $1,029,100 | $279,200 | $749,900 |
| 2023 | $14,663 | $870,700 | $273,600 | $597,100 |
| 2022 | $15,127 | $818,100 | $273,600 | $544,500 |
| 2021 | $14,812 | $798,900 | $273,600 | $525,300 |
| 2020 | $14,636 | $798,900 | $273,600 | $525,300 |
| 2019 | $14,644 | $798,900 | $273,600 | $525,300 |
| 2018 | $10,766 | $583,200 | $259,800 | $323,400 |
| 2017 | $9,961 | $559,600 | $259,800 | $299,800 |
| 2016 | $9,944 | $559,600 | $259,800 | $299,800 |
| 2015 | $10,388 | $558,800 | $251,100 | $307,700 |
Map
- 14C Mayberry Dr Unit 1
- 500 Union St Unit 5404
- 21 South St Unit 22
- 3202 Peters Farm Way Unit 202
- 3405 Peters Farm Way Unit 3405
- 24 Cedar St
- 24 School St
- 3 Beach St
- 11 Blake St
- 3 Quaker Way Unit 40
- 6 Ashley Way
- 129 Milk St
- 196 -198 Turnpike Rd
- 4 W End Ave
- 2 Park St Unit 2B
- 109 South St
- 147 Milk St Unit 16
- 4 Upton Rd
- 149 Milk St Unit 20
- 161 E Main St
Ask me questions while you tour the home.