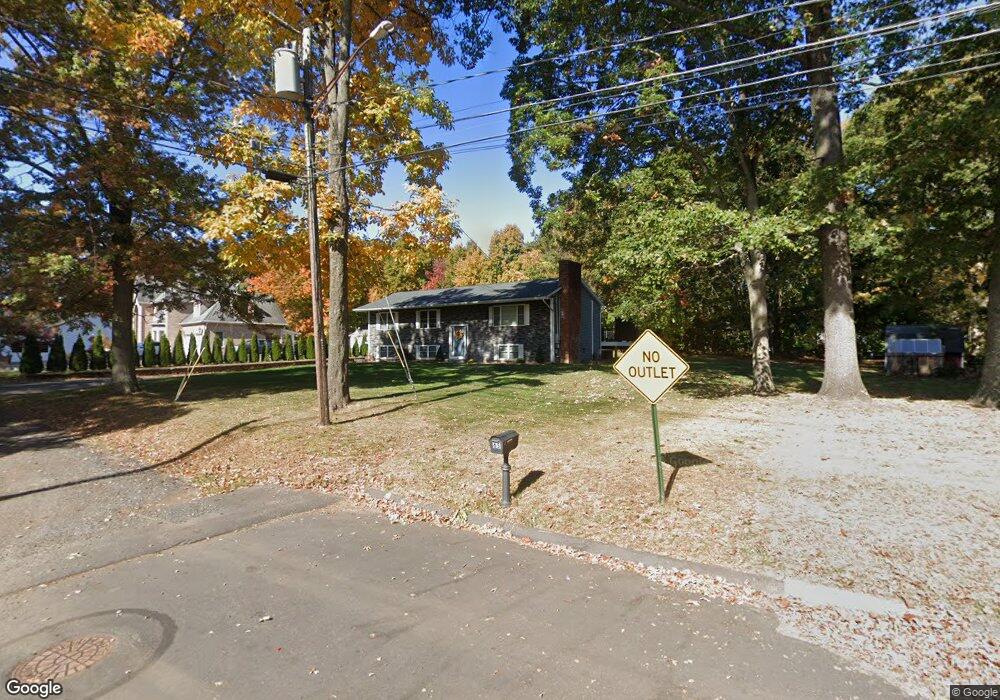
65 James Ave Southington, CT 06489
West Southington NeighborhoodEstimated Value: $493,441 - $549,000
3
Beds
2
Baths
1,790
Sq Ft
$288/Sq Ft
Est. Value
About This Home
This home is located at 65 James Ave, Southington, CT 06489 and is currently estimated at $516,110, approximately $288 per square foot. 65 James Ave is a home located in Hartford County with nearby schools including Urbin T. Kelley Elementary School, Joseph A. Depaolo Middle School, and Southington High School.
Ownership History
Date
Name
Owned For
Owner Type
Purchase Details
Closed on
Feb 28, 2022
Sold by
Laporte Gina
Bought by
Laporte Alexandra L and Warzocha Jesse E
Current Estimated Value
Home Financials for this Owner
Home Financials are based on the most recent Mortgage that was taken out on this home.
Original Mortgage
$300,000
Outstanding Balance
$276,438
Interest Rate
3.55%
Mortgage Type
Purchase Money Mortgage
Estimated Equity
$239,672
Purchase Details
Closed on
Mar 31, 2014
Sold by
Salerno Lucille Est and Salerno
Bought by
Laporte Gina
Create a Home Valuation Report for This Property
The Home Valuation Report is an in-depth analysis detailing your home's value as well as a comparison with similar homes in the area
Home Values in the Area
Average Home Value in this Area
Purchase History
| Date | Buyer | Sale Price | Title Company |
|---|---|---|---|
| Laporte Alexandra L | $400,000 | None Available | |
| Laporte Gina | $140,000 | -- | |
| Laporte Gina | $140,000 | -- |
Source: Public Records
Mortgage History
| Date | Status | Borrower | Loan Amount |
|---|---|---|---|
| Open | Laporte Alexandra L | $300,000 | |
| Previous Owner | Laporte Gina | $55,000 | |
| Previous Owner | Laporte Gina | $57,000 |
Source: Public Records
Tax History
| Year | Tax Paid | Tax Assessment Tax Assessment Total Assessment is a certain percentage of the fair market value that is determined by local assessors to be the total taxable value of land and additions on the property. | Land | Improvement |
|---|---|---|---|---|
| 2025 | $7,822 | $235,520 | $57,760 | $177,760 |
| 2024 | $7,405 | $235,520 | $57,760 | $177,760 |
| 2023 | $7,150 | $235,520 | $57,760 | $177,760 |
| 2022 | $6,861 | $235,520 | $57,760 | $177,760 |
| 2021 | $6,837 | $235,520 | $57,760 | $177,760 |
| 2020 | $6,307 | $205,920 | $58,930 | $146,990 |
| 2019 | $6,309 | $205,920 | $58,930 | $146,990 |
| 2018 | $6,276 | $205,920 | $58,930 | $146,990 |
| 2017 | $6,276 | $205,920 | $58,930 | $146,990 |
| 2016 | $4,515 | $152,320 | $58,930 | $93,390 |
| 2015 | $4,400 | $151,000 | $56,130 | $94,870 |
| 2014 | $4,282 | $151,000 | $56,130 | $94,870 |
Source: Public Records
Map
Nearby Homes
- 46 John St
- 500 Mill St Unit 8
- 119 Bishop Ave
- 485 West St
- 77 Howard Ave
- 82 Summer St Unit A
- 82 Summer St Unit B
- 185 West St Unit 4
- 218 Summit St
- 86 Bristol St
- 142 Liberty St
- 24 Vicki Ln
- 94 Huckleberry Ln
- 73 Jubilee Dr
- 141 Little Fawn Rd
- 309 Russet Ln
- 83 Little Fawn Rd
- 49 Mark Dr
- 87 Carter Ln
- 15 Woodruff St
Your Personal Tour Guide
Ask me questions while you tour the home.