65 Summer St Medway, MA 02053
Estimated Value: $545,068 - $651,000
About This Home
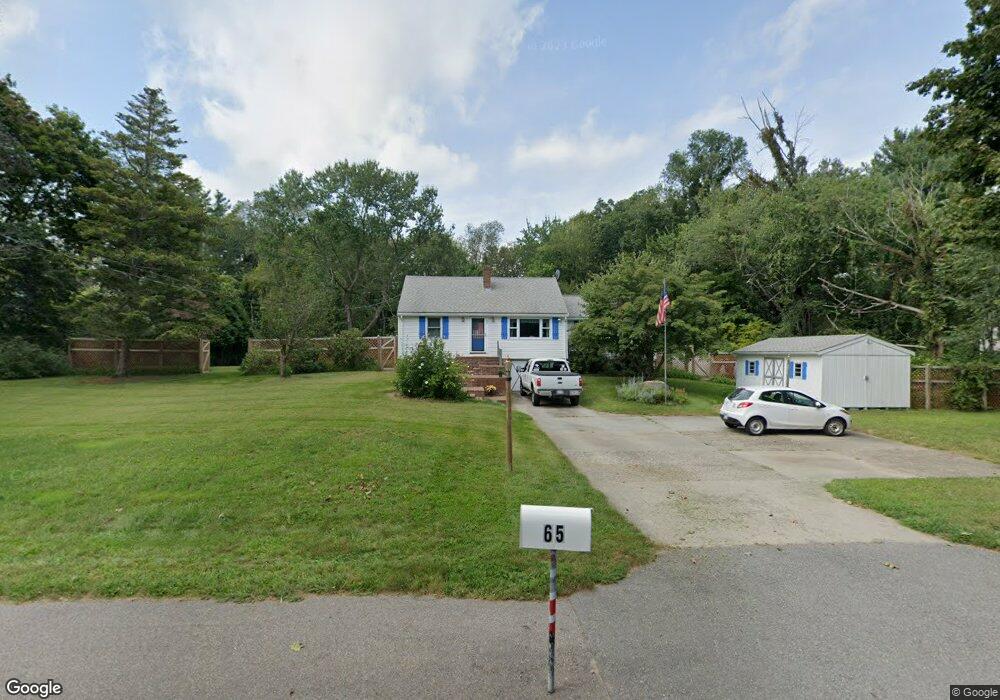
This home is located at 65 Summer St, Medway, MA 02053 and is currently estimated at $590,517, approximately $414 per square foot. 65 Summer St is a home located in Norfolk County with nearby schools including John D. McGovern Elementary School, Burke-Memorial Elementary, and Medway Middle School.
Ownership History
We collect this data history from publicly available records. To have your information removed, we recommend requesting removal directly through your county’s website.
Purchase Details
Purchase Details
Home Financials for this Owner
Home Financials are based on the most recent Mortgage that was taken out on this home.Home Values in the Area
Average Home Value in this Area
Purchase History
We collect this data history from publicly available records. To have your information removed, we recommend requesting removal directly through your county’s website.
| Date | Buyer | Sale Price | Title Company |
|---|---|---|---|
| -- | -- | ||
| $660,000 | -- |
Mortgage History
We collect this data history from publicly available records. To have your information removed, we recommend requesting removal directly through your county’s website.
| Date | Status | Borrower | Loan Amount |
|---|---|---|---|
| Previous Owner | $612,000 |
Tax History
We collect this data history from publicly available records. To have your information removed, we recommend requesting removal directly through your county’s website.
| Year | Tax Paid | Tax Assessment Tax Assessment Total Assessment is a certain percentage of the fair market value that is determined by local assessors to be the total taxable value of land and additions on the property. | Land | Improvement |
|---|---|---|---|---|
| 2025 | $6,874 | $482,400 | $269,600 | $212,800 |
| 2024 | $6,947 | $482,400 | $269,600 | $212,800 |
| 2023 | $6,754 | $423,700 | $232,200 | $191,500 |
| 2022 | $6,618 | $390,900 | $207,300 | $183,600 |
| 2021 | $6,179 | $353,900 | $186,600 | $167,300 |
| 2020 | $5,777 | $330,100 | $165,900 | $164,200 |
| 2019 | $5,602 | $330,100 | $165,900 | $164,200 |
| 2018 | $5,436 | $307,800 | $145,100 | $162,700 |
| 2017 | $5,249 | $292,900 | $134,800 | $158,100 |
| 2016 | $5,098 | $281,500 | $129,800 | $151,700 |
| 2015 | $4,943 | $271,000 | $122,300 | $148,700 |
| 2014 | $4,712 | $250,100 | $119,600 | $130,500 |
Map
- 50 Milford St
- 35 Milford St
- 3 Harmony Way Unit 3
- 25 Milford St
- 224 Main St
- 199 Main St
- 21 Autumn Rd
- 252 Main St
- 394 Village St
- 33 Lincoln St
- 28 Fisher St
- 23 Williamsburg Way Unit 23
- 328 Village St Unit 328
- 133 Summer St
- 1 Castle Rd
- 6 Haverstock Rd
- 3 Stable Way
- 5 Delmar Rd
- 137 Summer St
- 16 Stable Way
Ask me questions while you tour the home.