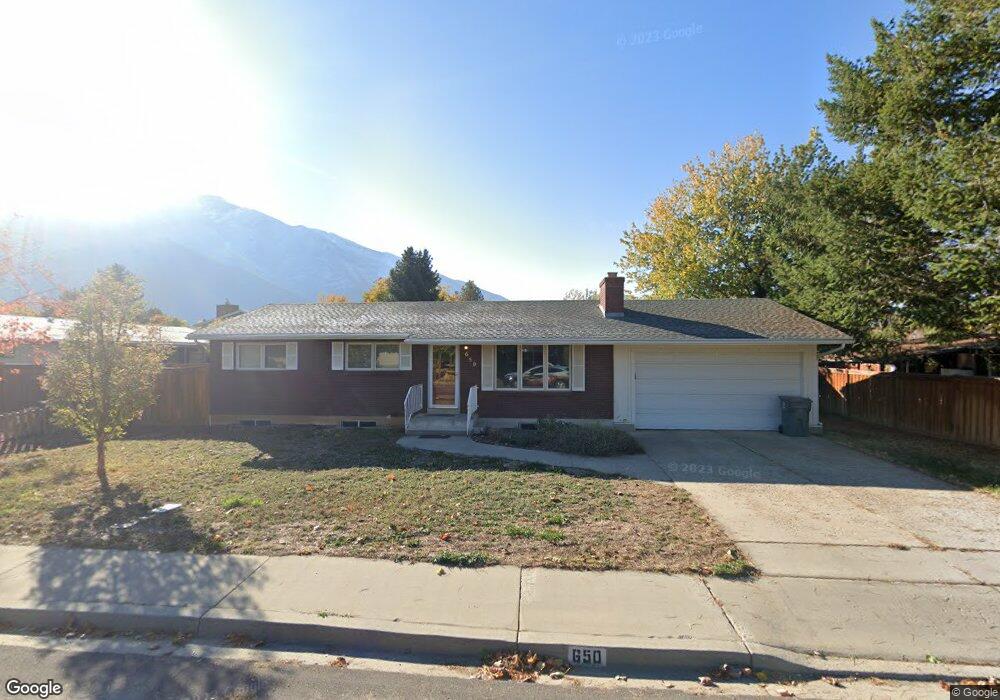
650 E 460 N Mapleton, UT 84664
Estimated Value: $498,000 - $587,000
5
Beds
3
Baths
2,346
Sq Ft
$229/Sq Ft
Est. Value
About This Home
This home is located at 650 E 460 N, Mapleton, UT 84664 and is currently estimated at $536,389, approximately $228 per square foot. 650 E 460 N is a home located in Utah County with nearby schools including Hobble Creek School, Mapleton Junior High School, and Maple Mountain High School.
Ownership History
Date
Name
Owned For
Owner Type
Purchase Details
Closed on
Aug 16, 2018
Sold by
Reed David B and Reed Marya
Bought by
Reed David Benson and Reed Marya
Current Estimated Value
Purchase Details
Closed on
Feb 25, 1997
Sold by
Berrett Bradley G and Berrett Dianna H
Bought by
Reed David B and Reed Marya
Home Financials for this Owner
Home Financials are based on the most recent Mortgage that was taken out on this home.
Original Mortgage
$85,000
Outstanding Balance
$10,417
Interest Rate
7.86%
Estimated Equity
$525,972
Create a Home Valuation Report for This Property
The Home Valuation Report is an in-depth analysis detailing your home's value as well as a comparison with similar homes in the area
Home Values in the Area
Average Home Value in this Area
Purchase History
| Date | Buyer | Sale Price | Title Company |
|---|---|---|---|
| Reed David Benson | -- | None Available | |
| Reed David B | -- | -- |
Source: Public Records
Mortgage History
| Date | Status | Borrower | Loan Amount |
|---|---|---|---|
| Open | Reed David B | $85,000 |
Source: Public Records
Tax History
| Year | Tax Paid | Tax Assessment Tax Assessment Total Assessment is a certain percentage of the fair market value that is determined by local assessors to be the total taxable value of land and additions on the property. | Land | Improvement |
|---|---|---|---|---|
| 2025 | $2,369 | $250,085 | -- | -- |
| 2024 | $2,369 | $232,045 | $0 | $0 |
| 2023 | $2,409 | $237,435 | $0 | $0 |
| 2022 | $2,416 | $235,455 | $0 | $0 |
| 2021 | $1,979 | $296,100 | $144,000 | $152,100 |
| 2020 | $1,931 | $279,500 | $127,400 | $152,100 |
| 2019 | $1,723 | $254,600 | $122,300 | $132,300 |
| 2018 | $1,559 | $219,300 | $103,000 | $116,300 |
| 2017 | $1,568 | $117,040 | $0 | $0 |
| 2016 | $1,530 | $113,520 | $0 | $0 |
| 2015 | $1,366 | $100,760 | $0 | $0 |
| 2014 | $1,265 | $91,630 | $0 | $0 |
Source: Public Records
Map
Nearby Homes
- 310 N 800 E
- 775 N 800 E
- 141 N 600 E
- 162 N 800 E
- 265 E 600 N
- 594 E 1000 N
- 745 E Maple St
- 415 E Maple St
- 1377 E Maple St
- 435 E 1000 N
- 84 E 530 N
- 1096 N 1000 E
- 897 N Main St
- 1515 E Maple St
- 1350 N Main St
- 1567 N 600 E Unit 26
- 1447 N 1350 St E Unit 5
- 1577 N 1350 St E Unit 1
- 1477 N 1350 St E Unit 4
- 1547 N 1350 St E Unit 2
Your Personal Tour Guide
Ask me questions while you tour the home.