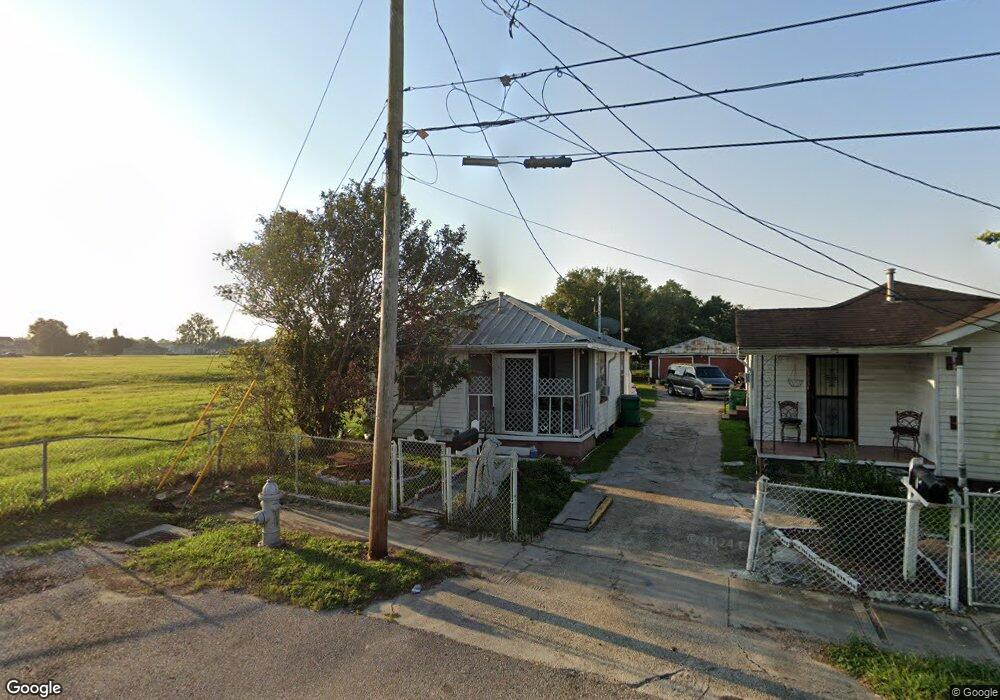
6501 5th St Marrero, LA 70072
2
Beds
1
Bath
600
Sq Ft
--
Built
About This Home
This home is located at 6501 5th St, Marrero, LA 70072. 6501 5th St is a home located in Jefferson Parish with nearby schools including Judge Lionel R. Collins Elementary School, Ray St. Pierre Academy for Advanced Studies, and Stella Worley Middle School.
Create a Home Valuation Report for This Property
The Home Valuation Report is an in-depth analysis detailing your home's value as well as a comparison with similar homes in the area
Home Values in the Area
Average Home Value in this Area
Tax History
| Year | Tax Paid | Tax Assessment Tax Assessment Total Assessment is a certain percentage of the fair market value that is determined by local assessors to be the total taxable value of land and additions on the property. | Land | Improvement |
|---|---|---|---|---|
| 2025 | $1,465 | $11,130 | $2,070 | $9,060 |
| 2024 | $787 | $11,130 | $2,070 | $9,060 |
| 2023 | $1,526 | $11,130 | $2,070 | $9,060 |
| 2022 | $1,489 | $11,130 | $2,070 | $9,060 |
| 2021 | $1,408 | $11,130 | $2,070 | $9,060 |
| 2020 | $1,378 | $11,130 | $2,070 | $9,060 |
| 2019 | $1,344 | $10,340 | $1,660 | $8,680 |
| 2018 | $1,260 | $10,340 | $1,660 | $8,680 |
| 2017 | $1,212 | $10,340 | $1,660 | $8,680 |
| 2016 | $1,189 | $10,340 | $1,660 | $8,680 |
| 2015 | $1,272 | $11,000 | $1,330 | $9,670 |
| 2014 | $1,272 | $11,000 | $1,330 | $9,670 |
Source: Public Records
Map
Nearby Homes
Your Personal Tour Guide
Ask me questions while you tour the home.