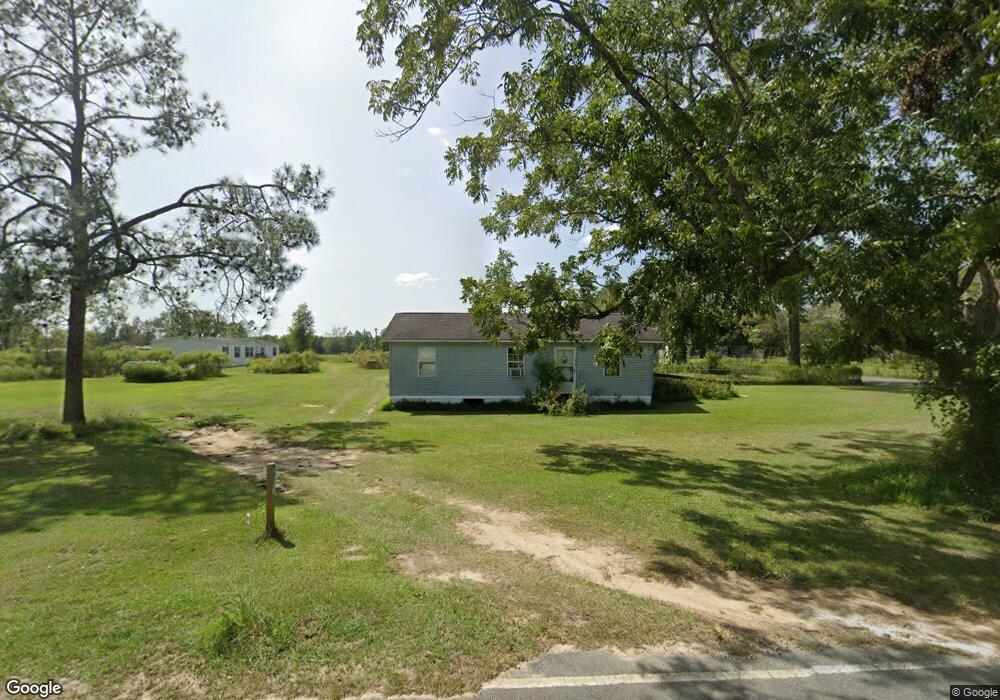
6514 Offerman Loop Patterson, GA 31557
Estimated Value: $118,483 - $167,000
2
Beds
1
Bath
1,046
Sq Ft
$135/Sq Ft
Est. Value
About This Home
This home is located at 6514 Offerman Loop, Patterson, GA 31557 and is currently estimated at $141,371, approximately $135 per square foot. 6514 Offerman Loop is a home located in Pierce County with nearby schools including Pierce County High School and Southeast Christian Academy.
Ownership History
Date
Name
Owned For
Owner Type
Purchase Details
Closed on
Jun 12, 2014
Sold by
Stephens Edward Eugene
Bought by
Stephens Edward Eugenen and Boatright Betty Ann
Current Estimated Value
Purchase Details
Closed on
Dec 30, 1997
Sold by
Stephens Priscilla E
Bought by
Stephens Edward Eugene
Purchase Details
Closed on
Dec 2, 1997
Sold by
Crews Kizzie Mae Etal
Bought by
Stephens Priscilla
Purchase Details
Closed on
Mar 21, 1983
Sold by
Stephens Priscilla
Bought by
Crews Kizzie Mae
Purchase Details
Closed on
Feb 1, 1982
Sold by
Daniels Junior Etal
Bought by
Stephens Priscilla
Purchase Details
Closed on
Mar 28, 1981
Sold by
Daniels Ida Mae
Bought by
Stephens Priscilla Daniels
Purchase Details
Closed on
Feb 8, 1961
Sold by
Phillips N E Mrs
Bought by
Daniels H B
Purchase Details
Closed on
Dec 31, 1954
Sold by
Allie Griner H and Allie Mae
Bought by
Ida Daniels H and Ida Mae
Purchase Details
Closed on
Sep 30, 1914
Sold by
Dean Realty & Improvement Company
Bought by
Phillips N E
Create a Home Valuation Report for This Property
The Home Valuation Report is an in-depth analysis detailing your home's value as well as a comparison with similar homes in the area
Purchase History
| Date | Buyer | Sale Price | Title Company |
|---|---|---|---|
| Stephens Edward Eugenen | -- | -- | |
| Stephens Edward Eugene | -- | -- | |
| Stephens Priscilla | -- | -- | |
| Crews Kizzie Mae | -- | -- | |
| Stephens Priscilla | -- | -- | |
| Stephens Priscilla Daniels | -- | -- | |
| Daniels H B | -- | -- | |
| Ida Daniels H | -- | -- | |
| Phillips N E | -- | -- |
Source: Public Records
Tax History
| Year | Tax Paid | Tax Assessment Tax Assessment Total Assessment is a certain percentage of the fair market value that is determined by local assessors to be the total taxable value of land and additions on the property. | Land | Improvement |
|---|---|---|---|---|
| 2025 | $627 | $28,522 | $2,400 | $26,122 |
| 2024 | $589 | $27,146 | $2,400 | $24,746 |
| 2023 | $575 | $26,551 | $2,400 | $24,151 |
| 2022 | $503 | $20,632 | $2,330 | $18,302 |
| 2021 | $525 | $19,910 | $2,330 | $17,580 |
| 2020 | $570 | $19,188 | $2,330 | $16,858 |
| 2019 | $520 | $19,188 | $2,330 | $16,858 |
| 2018 | $499 | $18,466 | $2,330 | $16,136 |
| 2017 | $489 | $17,813 | $2,330 | $15,483 |
| 2016 | $486 | $17,813 | $2,330 | $15,483 |
| 2015 | $518 | $17,812 | $2,330 | $15,483 |
| 2014 | $518 | $17,813 | $2,330 | $15,483 |
| 2013 | $518 | $17,812 | $2,329 | $15,483 |
Source: Public Records
Map
Nearby Homes
- 6193 Offerman Loop
- 3285 Tyre Bridge Rd
- 5772 Industrial Blvd
- 5661 E Railroad Ave
- 3540 Williams St
- 3501 Martin St
- 3231 Pear Ave
- 5518 W Railroad Ave
- 3442 Wildwood Ave
- 3432 Nellie St
- 3440 Nellie St
- 0 Eden Rd
- 5209 Georgia 32
- 5209 Ga Highway 32
- 5574 Walkerville Rd
- 2114 Mill Creek Rd
- 6940 Oak Crossing Rd
- 3587 Cathleen Dr
- 6959 Oak Crossing Rd
- 6005 Chancey Rd
- 6500 Offerman Loop
- 6499 Offerman Loop
- 6534 Offerman Loop
- 3122 S Birmingham St
- 3152 Lincoln Loop
- 3104 S Birmingham St
- 6225 Gardenia Dr
- 3015 Hampton Rd
- 6490 Offerman Loop
- 6559 Offerman Loop
- 3090 S Birmingham Ave
- 6251 Gardenia Dr
- 3090 S Birmingham St
- 3316 Lincoln Loop
- 3101 N Birmingham St
- 3200 Lincoln Loop
- 6226 Gardenia Dr
- 6150 Howard St
- 6267 Gardenia Dr
- 6267 Gardenia Dr
Your Personal Tour Guide
Ask me questions while you tour the home.