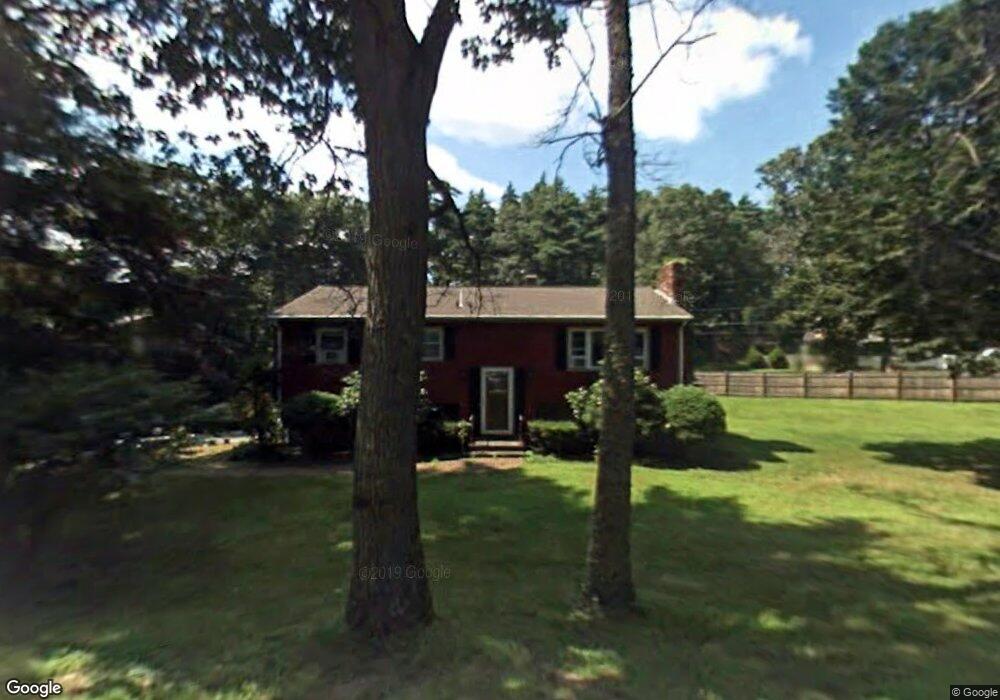
655 Berkley St Berkley, MA 02779
Estimated Value: $436,000 - $502,000
3
Beds
1
Bath
1,056
Sq Ft
$449/Sq Ft
Est. Value
About This Home
This home is located at 655 Berkley St, Berkley, MA 02779 and is currently estimated at $474,405, approximately $449 per square foot. 655 Berkley St is a home located in Bristol County with nearby schools including Berkley Community School and Our Lady of Lourdes School.
Ownership History
Date
Name
Owned For
Owner Type
Purchase Details
Closed on
Jun 10, 2022
Sold by
Sousa Jose F and Sousa Ana M
Bought by
Rice Diana M and Rice Michael E
Current Estimated Value
Purchase Details
Closed on
May 28, 1987
Sold by
Barbasa Joseph A
Bought by
Sousa Jose F
Create a Home Valuation Report for This Property
The Home Valuation Report is an in-depth analysis detailing your home's value as well as a comparison with similar homes in the area
Purchase History
| Date | Buyer | Sale Price | Title Company |
|---|---|---|---|
| Rice Diana M | -- | None Available | |
| Sousa Jose F | $148,000 | -- |
Source: Public Records
Mortgage History
| Date | Status | Borrower | Loan Amount |
|---|---|---|---|
| Previous Owner | Sousa Jose F | $235,188 | |
| Previous Owner | Sousa Jose F | $8,400 | |
| Previous Owner | Sousa Jose F | $141,399 |
Source: Public Records
Tax History
| Year | Tax Paid | Tax Assessment Tax Assessment Total Assessment is a certain percentage of the fair market value that is determined by local assessors to be the total taxable value of land and additions on the property. | Land | Improvement |
|---|---|---|---|---|
| 2025 | $50 | $413,100 | $117,200 | $295,900 |
| 2024 | $4,787 | $384,500 | $101,000 | $283,500 |
| 2023 | $4,575 | $346,100 | $101,000 | $245,100 |
| 2022 | $4,462 | $324,500 | $87,800 | $236,700 |
| 2021 | $4,476 | $304,900 | $83,600 | $221,300 |
| 2020 | $4,275 | $299,900 | $73,900 | $226,000 |
| 2019 | $197 | $289,900 | $73,900 | $216,000 |
| 2018 | $4,145 | $278,300 | $71,100 | $207,200 |
| 2017 | $182 | $266,000 | $79,700 | $186,300 |
| 2016 | $3,686 | $248,400 | $79,700 | $168,700 |
| 2015 | $3,443 | $247,500 | $79,700 | $167,800 |
| 2014 | $3,284 | $256,400 | $86,500 | $169,900 |
Source: Public Records
Map
Nearby Homes
- 656 Berkley St
- 3 Town Landing Rd
- 6 Town Landing Rd
- 654 Berkley St
- 658 Berkley St
- 5 Town Landing Rd
- 653 Berkley St
- 652 Berkley St
- 659 Berkley St
- 1 Saints Way
- 660 Berkley St
- 8 Town Landing Rd
- 651 Berkley St
- 78 Sanford St
- 3 Saints Way
- 80 Sanford St
- 10 Town Landing Rd
- 662 Berkley St
- 70 Forrest St
- 663 Berkley St
Your Personal Tour Guide
Ask me questions while you tour the home.