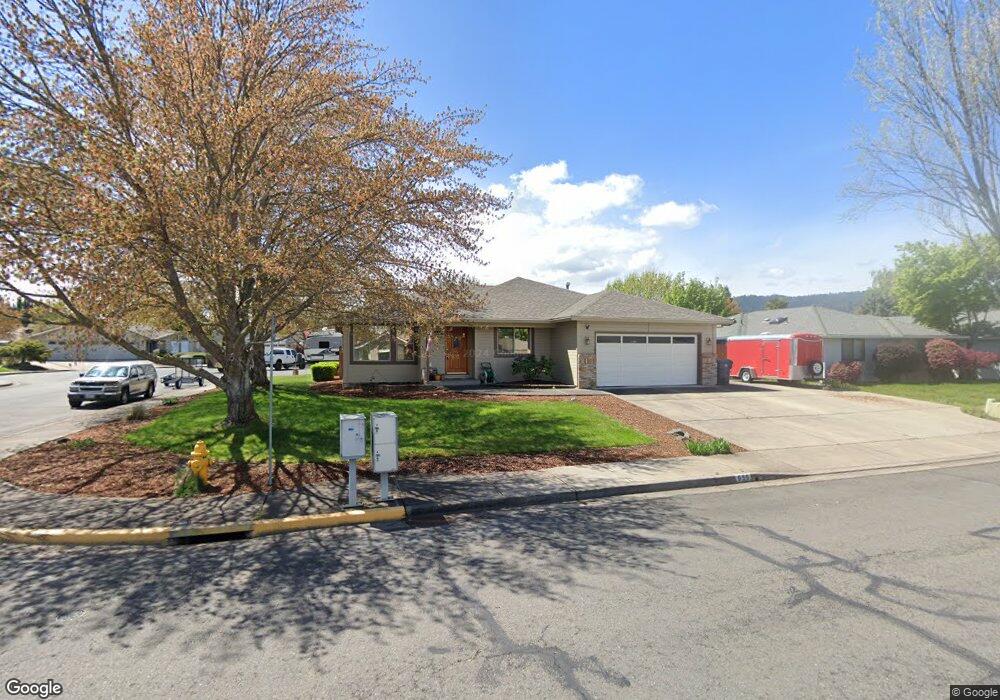
655 Brandon St Central Point, OR 97502
Estimated Value: $380,414 - $454,000
About This Home
This home is located at 655 Brandon St, Central Point, OR 97502 and is currently estimated at $419,104, approximately $307 per square foot. 655 Brandon St is a home located in Jackson County with nearby schools including Richardson Elementary School, Scenic Middle School, and Crater High School.
Ownership History
We collect this data history from publicly available records. To have your information removed, we recommend requesting removal directly through your county’s website.
Purchase Details
Home Financials for this Owner
Home Financials are based on the most recent Mortgage that was taken out on this home.Purchase Details
Purchase History
We collect this data history from publicly available records. To have your information removed, we recommend requesting removal directly through your county’s website.
| Date | Buyer | Sale Price | Title Company |
|---|---|---|---|
| $128,760 | Amerititle | ||
| $102,971 | Amerititle |
Mortgage History
We collect this data history from publicly available records. To have your information removed, we recommend requesting removal directly through your county’s website.
| Date | Status | Borrower | Loan Amount |
|---|---|---|---|
| Open | $55,000 | ||
| Closed | $131,335 |
Tax History
We collect this data history from publicly available records. To have your information removed, we recommend requesting removal directly through your county’s website.
| Year | Tax Paid | Tax Assessment Tax Assessment Total Assessment is a certain percentage of the fair market value that is determined by local assessors to be the total taxable value of land and additions on the property. | Land | Improvement |
|---|---|---|---|---|
| 2026 | $4,199 | $249,270 | $126,000 | $123,270 |
| 2025 | $4,095 | $246,330 | $104,840 | $141,490 |
| 2024 | $4,095 | $239,160 | $101,790 | $137,370 |
| 2023 | $3,964 | $232,200 | $98,830 | $133,370 |
| 2022 | $3,871 | $232,200 | $98,830 | $133,370 |
| 2021 | $3,761 | $225,440 | $95,950 | $129,490 |
| 2020 | $3,651 | $218,880 | $93,160 | $125,720 |
| 2019 | $3,561 | $206,330 | $87,820 | $118,510 |
| 2018 | $3,453 | $200,330 | $85,260 | $115,070 |
| 2017 | $3,366 | $200,330 | $85,260 | $115,070 |
| 2016 | $3,268 | $188,840 | $80,360 | $108,480 |
| 2015 | $3,131 | $188,840 | $80,360 | $108,480 |
| 2014 | $3,051 | $178,000 | $75,750 | $102,250 |
Map
- 752 Mallory Ct
- 182 Justin Ct
- 876 Holley Way
- 895 Holley Way
- 741 Lynn Ln
- 610 Pheasant Creek
- 3575 Hanley Rd
- 557 Glenn Way
- 574 Grey Hawk Way
- 629 Glenn Way
- 349 W Pine St
- 50 Kathryn Ct
- 278 Tyler Ave
- 453 S Haskell St
- 429 Mayberry Ln
- 345 Meadow Lark Way
- 933 Rose Valley Dr
- 450 Grand Ave
- 2797 Beall Ln
- 604 Hemlock Ave
- 656 Brandon St
- 610 Brandon St
- 138 Tiffany Ave
- 117 Tiffany Ave
- 155 Tiffany Ave
- 606 Brandon St
- 609 Brandon St
- 162 Tiffany Ave
- 187 Tiffany Ave
- 119 Tiffany Ct
- 143 Justin Ct
- 605 Brandon St
- 155 Justin Ct
- 602 Brandon St
- 129 Justin Ct
- 710 Brandon St
- 128 Tiffany Ct
- 797 Vincent Ave
- 709 Brandon St
- 117 Justin Ct
Ask me questions while you tour the home.