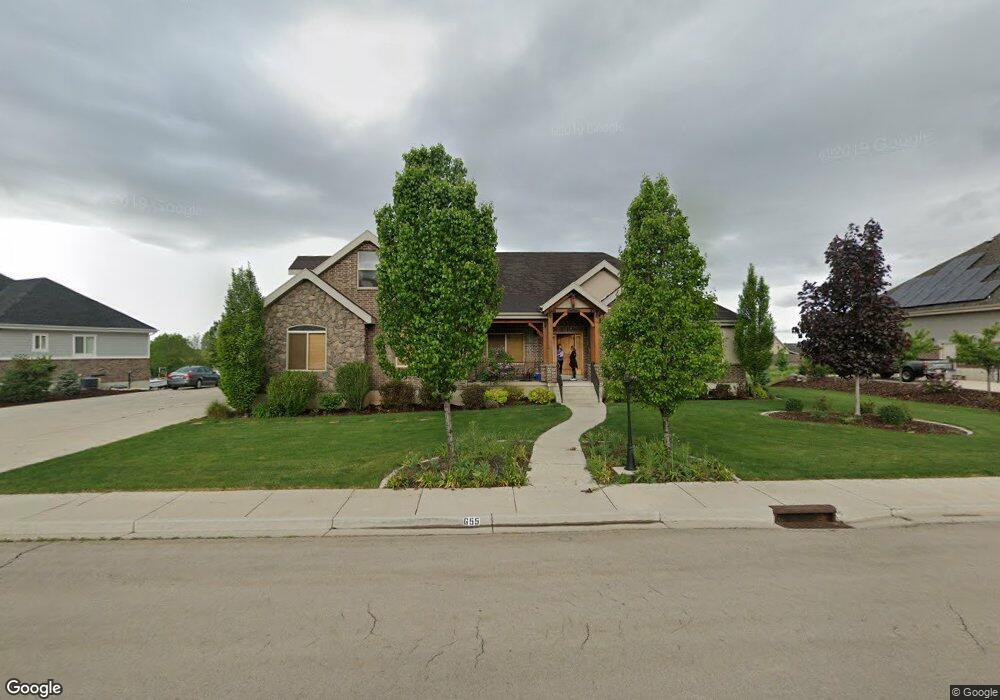
655 N 1200 E Mapleton, UT 84664
Estimated Value: $1,301,918 - $1,508,000
4
Beds
4
Baths
5,515
Sq Ft
$251/Sq Ft
Est. Value
About This Home
This home is located at 655 N 1200 E, Mapleton, UT 84664 and is currently estimated at $1,384,730, approximately $251 per square foot. 655 N 1200 E is a home located in Utah County with nearby schools including Hobble Creek School, Mapleton Junior High School, and Maple Mountain High School.
Ownership History
Date
Name
Owned For
Owner Type
Purchase Details
Closed on
Jun 2, 2009
Sold by
Washington Trust Bank
Bought by
Brown David R and Brown Polly A
Current Estimated Value
Home Financials for this Owner
Home Financials are based on the most recent Mortgage that was taken out on this home.
Original Mortgage
$417,000
Outstanding Balance
$263,608
Interest Rate
4.78%
Mortgage Type
Purchase Money Mortgage
Estimated Equity
$1,121,122
Purchase Details
Closed on
Sep 22, 2008
Sold by
Zions Builders Inc
Bought by
Washington Trust Bank
Purchase Details
Closed on
Sep 9, 2008
Sold by
Hone Gary D
Bought by
Zions Builders Inc
Purchase Details
Closed on
Jan 4, 2008
Sold by
Hone Gary D and Zions Builders Inc
Bought by
Zions Builders Inc
Purchase Details
Closed on
Nov 2, 2006
Sold by
Sierra Capital Lc
Bought by
Zions Builders Inc
Home Financials for this Owner
Home Financials are based on the most recent Mortgage that was taken out on this home.
Original Mortgage
$496,000
Interest Rate
6.28%
Mortgage Type
Purchase Money Mortgage
Create a Home Valuation Report for This Property
The Home Valuation Report is an in-depth analysis detailing your home's value as well as a comparison with similar homes in the area
Home Values in the Area
Average Home Value in this Area
Purchase History
| Date | Buyer | Sale Price | Title Company |
|---|---|---|---|
| Brown David R | -- | First American Spanish Fo | |
| Washington Trust Bank | $529,170 | Accommodation | |
| Zions Builders Inc | -- | Horizon Title Insurance | |
| Zions Builders Inc | -- | First American Title Insuran | |
| Hone Gary D | -- | None Available | |
| Zions Builders Inc | -- | Bartlett Title Insurance Ag |
Source: Public Records
Mortgage History
| Date | Status | Borrower | Loan Amount |
|---|---|---|---|
| Open | Brown David R | $417,000 | |
| Previous Owner | Zions Builders Inc | $496,000 |
Source: Public Records
Tax History
| Year | Tax Paid | Tax Assessment Tax Assessment Total Assessment is a certain percentage of the fair market value that is determined by local assessors to be the total taxable value of land and additions on the property. | Land | Improvement |
|---|---|---|---|---|
| 2025 | $5,844 | $604,340 | -- | -- |
| 2024 | $5,844 | $572,495 | $0 | $0 |
| 2023 | $6,031 | $594,550 | $0 | $0 |
| 2022 | $6,490 | $632,610 | $0 | $0 |
| 2021 | $5,362 | $802,400 | $299,700 | $502,700 |
| 2020 | $5,274 | $763,500 | $280,100 | $483,400 |
| 2019 | $5,133 | $758,500 | $275,100 | $483,400 |
| 2018 | $5,002 | $703,600 | $240,100 | $463,500 |
| 2017 | $5,110 | $381,480 | $0 | $0 |
| 2016 | $4,101 | $304,315 | $0 | $0 |
| 2015 | $4,051 | $298,815 | $0 | $0 |
| 2014 | $3,733 | $270,380 | $0 | $0 |
Source: Public Records
Map
Nearby Homes
- 775 N 800 E
- 1096 N 1000 E
- 310 N 800 E
- 162 N 800 E
- 630 N 1600 E
- 1515 E Maple St
- 594 E 1000 N
- 1377 E Maple St
- 1548 N 1350 St E Unit 11
- 1578 N 1350 St E Unit 12
- 1447 N 1350 St E Unit 5
- 1577 N 1350 St E Unit 1
- 1477 N 1350 St E Unit 4
- 1547 N 1350 St E Unit 2
- 1511 N 1350 St E Unit 3
- 745 E Maple St
- 141 N 600 E
- 435 E 1000 N
- 1564 N 1700 East St
- 702 N 2000 E Unit 305
- 697 N 1200 E Unit 11
- 607 N 1200 E Unit 13
- 607 N 1200 E
- 634 N 1200 E
- 634 N 1200 E Unit 5
- 676 N 1200 E
- 676 N 1200 E Unit 6
- 739 N 1200 E
- 559 N 1200 E
- 588 N 1200 E Unit 4
- 720 N 1200 E Unit 7
- 511 N 1200 E Unit 15
- 767 N 1200 E
- 767 N 1200 E Unit 9
- 760 N 1200 E
- 534 N 1200 E
- 534 N 1200 E Unit 3
- 632 N 1000 E
- 674 N 1000 E
- 718 N 1000 E
Your Personal Tour Guide
Ask me questions while you tour the home.