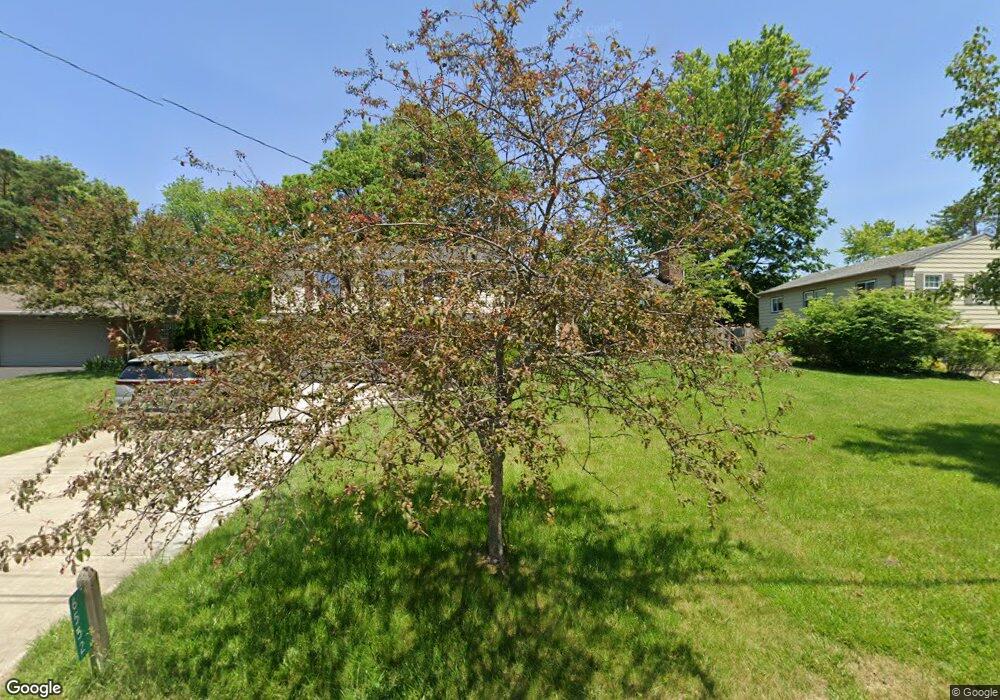
6552 Lisa Ln Cincinnati, OH 45243
Estimated Value: $522,698 - $609,000
5
Beds
3
Baths
2,678
Sq Ft
$214/Sq Ft
Est. Value
About This Home
This home is located at 6552 Lisa Ln, Cincinnati, OH 45243 and is currently estimated at $571,925, approximately $213 per square foot. 6552 Lisa Ln is a home located in Hamilton County with nearby schools including Indian Hill Primary School, Indian Hill Elementary School, and Indian Hill Middle School.
Ownership History
Date
Name
Owned For
Owner Type
Purchase Details
Closed on
Oct 20, 2017
Sold by
Stagge Mark S and Stagge Sarah J
Bought by
He Yanhong and Zeng Xiaohui
Current Estimated Value
Home Financials for this Owner
Home Financials are based on the most recent Mortgage that was taken out on this home.
Original Mortgage
$232,000
Interest Rate
3.83%
Mortgage Type
New Conventional
Purchase Details
Closed on
May 15, 1991
Sold by
Stagge Mark S
Bought by
Stagge Mark S
Create a Home Valuation Report for This Property
The Home Valuation Report is an in-depth analysis detailing your home's value as well as a comparison with similar homes in the area
Home Values in the Area
Average Home Value in this Area
Purchase History
| Date | Buyer | Sale Price | Title Company |
|---|---|---|---|
| He Yanhong | $290,000 | None Available | |
| Stagge Mark S | $110,000 | -- |
Source: Public Records
Mortgage History
| Date | Status | Borrower | Loan Amount |
|---|---|---|---|
| Previous Owner | He Yanhong | $232,000 |
Source: Public Records
Tax History
| Year | Tax Paid | Tax Assessment Tax Assessment Total Assessment is a certain percentage of the fair market value that is determined by local assessors to be the total taxable value of land and additions on the property. | Land | Improvement |
|---|---|---|---|---|
| 2025 | $5,222 | $130,039 | $31,185 | $98,854 |
| 2023 | $5,113 | $130,039 | $31,185 | $98,854 |
| 2022 | $4,877 | $101,500 | $21,329 | $80,171 |
| 2021 | $4,751 | $101,500 | $21,329 | $80,171 |
| 2020 | $4,238 | $101,500 | $21,329 | $80,171 |
| 2019 | $3,997 | $89,261 | $18,711 | $70,550 |
| 2018 | $4,006 | $89,261 | $18,711 | $70,550 |
| 2017 | $3,820 | $89,261 | $18,711 | $70,550 |
| 2016 | $3,407 | $78,870 | $17,028 | $61,842 |
| 2015 | $3,431 | $78,870 | $17,028 | $61,842 |
| 2014 | $3,410 | $78,870 | $17,028 | $61,842 |
| 2013 | $3,366 | $75,114 | $16,216 | $58,898 |
Source: Public Records
Map
Nearby Homes
- 7752 Montgomery Rd
- 7159 Hosbrook Rd
- 7151 Euclid Ave
- 6752 Rose Crest Ave
- 7321 Hosbrook Rd
- 7220 Mar Del Dr
- 7406 Dawson Rd
- 7317 Euclid Ave
- 7024 Fowler Ave
- 7389 Southside Ave
- 7300 N Mingo Ln
- 7474 Dawson Rd
- 4390 Yakima Ct
- 7503 S Timberlane Dr
- 7156 Maple Ave
- 4673 Happiness Way
- 4300 Hegner Ave
- 7938 Queens Ave
- 4248 South Ave
- 7437 Madeira Pines Dr
Your Personal Tour Guide
Ask me questions while you tour the home.