657 Rose Ave Des Plaines, IL 60016
Des Plaines AreaEstimated Value: $449,000 - $581,000
About This Home
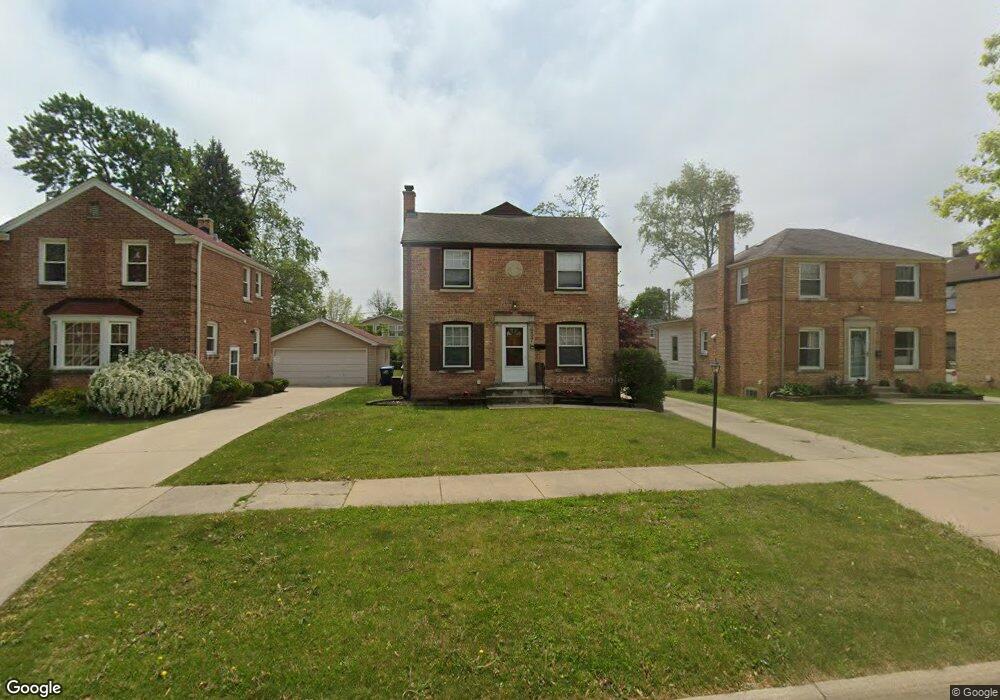
This home is located at 657 Rose Ave, Des Plaines, IL 60016 and is currently estimated at $529,391, approximately $226 per square foot. 657 Rose Ave is a home located in Cook County with nearby schools including Terrace Elementary School, Chippewa Middle School, and Maine West High School.
Ownership History
We collect this data history from publicly available records. To have your information removed, we recommend requesting removal directly through your county’s website.
Purchase Details
Home Financials for this Owner
Home Financials are based on the most recent Mortgage that was taken out on this home.Home Values in the Area
Average Home Value in this Area
Purchase History
We collect this data history from publicly available records. To have your information removed, we recommend requesting removal directly through your county’s website.
| Date | Buyer | Sale Price | Title Company |
|---|---|---|---|
| -- | -- |
Mortgage History
We collect this data history from publicly available records. To have your information removed, we recommend requesting removal directly through your county’s website.
| Date | Status | Borrower | Loan Amount |
|---|---|---|---|
| Closed | $150,000 |
Tax History
We collect this data history from publicly available records. To have your information removed, we recommend requesting removal directly through your county’s website.
| Year | Tax Paid | Tax Assessment Tax Assessment Total Assessment is a certain percentage of the fair market value that is determined by local assessors to be the total taxable value of land and additions on the property. | Land | Improvement |
|---|---|---|---|---|
| 2025 | $9,935 | $47,000 | $5,589 | $41,411 |
| 2024 | $9,935 | $41,001 | $4,658 | $36,343 |
| 2023 | $9,670 | $41,001 | $4,658 | $36,343 |
| 2022 | $9,670 | $41,001 | $4,658 | $36,343 |
| 2021 | $10,486 | $37,444 | $3,726 | $33,718 |
| 2020 | $10,378 | $37,444 | $3,726 | $33,718 |
| 2019 | $10,274 | $41,605 | $3,726 | $37,879 |
| 2018 | $8,926 | $33,282 | $3,260 | $30,022 |
| 2017 | $8,786 | $33,282 | $3,260 | $30,022 |
| 2016 | $8,555 | $33,282 | $3,260 | $30,022 |
| 2015 | $7,622 | $27,835 | $2,794 | $25,041 |
| 2014 | $7,477 | $27,835 | $2,794 | $25,041 |
| 2013 | $7,274 | $27,835 | $2,794 | $25,041 |
Map
- 556 Crestwood Dr
- 822 E Prairie Ave
- 839 E Thacker St
- 69 Nicholas Dr W
- 870 E Thacker St
- 960 Alfini Dr
- 980 W Grant Dr
- 1024 S Wolf Rd
- 963 E Prairie Ave
- 904 S 2nd Ave
- 890 North Ave
- 576 Bedford Ln
- 1078 Greenview Ave
- 1205 S Wolf Rd
- 289 Oxford Rd
- 1052 Margret St
- 736 Arlington Ave
- 389 S Westgate Rd
- 30 W Kathleen Dr
- 510 S Mount Prospect Rd
Ask me questions while you tour the home.