66 Appleton St Quincy, MA 02171
North Quincy NeighborhoodEstimated Value: $650,000 - $750,000
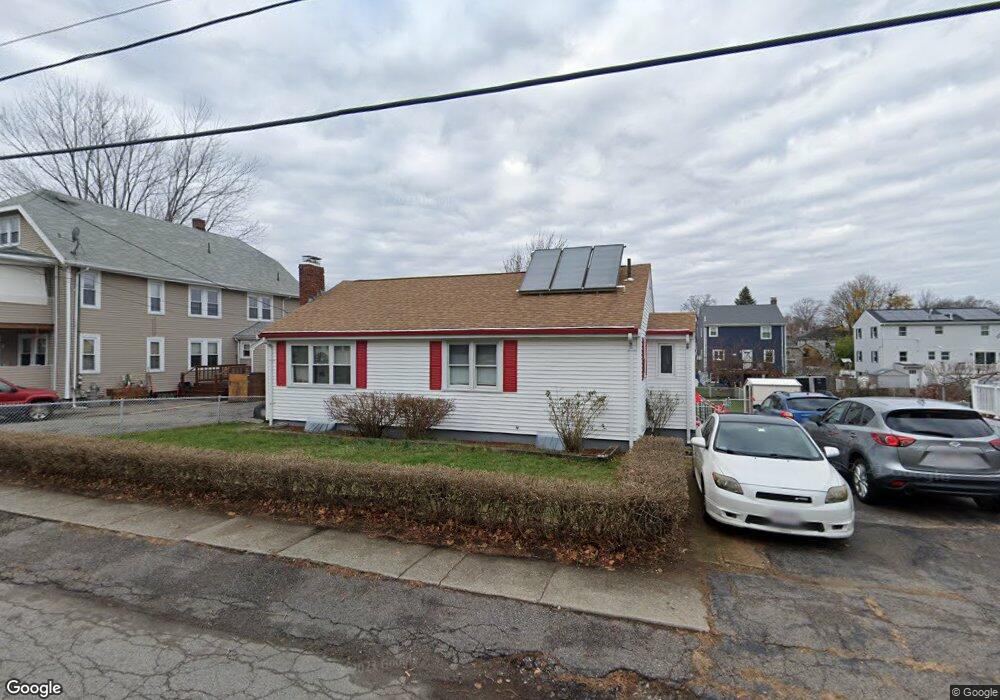
About This Home
This home is located at 66 Appleton St, Quincy, MA 02171 and is currently estimated at $704,247, approximately $558 per square foot. 66 Appleton St is a home located in Norfolk County with nearby schools including Francis W. Parker Elementary School, Atlantic Middle School, and North Quincy High School.
Ownership History
We collect this data history from publicly available records. To have your information removed, we recommend requesting removal directly through your county’s website.
Purchase Details
Home Financials for this Owner
Home Financials are based on the most recent Mortgage that was taken out on this home.Home Values in the Area
Average Home Value in this Area
Purchase History
We collect this data history from publicly available records. To have your information removed, we recommend requesting removal directly through your county’s website.
| Date | Buyer | Sale Price | Title Company |
|---|---|---|---|
| $153,000 | -- |
Mortgage History
We collect this data history from publicly available records. To have your information removed, we recommend requesting removal directly through your county’s website.
| Date | Status | Borrower | Loan Amount |
|---|---|---|---|
| Closed | $70,000 |
Tax History
We collect this data history from publicly available records. To have your information removed, we recommend requesting removal directly through your county’s website.
| Year | Tax Paid | Tax Assessment Tax Assessment Total Assessment is a certain percentage of the fair market value that is determined by local assessors to be the total taxable value of land and additions on the property. | Land | Improvement |
|---|---|---|---|---|
| 2025 | $7,701 | $667,900 | $422,800 | $245,100 |
| 2024 | $7,500 | $665,500 | $422,800 | $242,700 |
| 2023 | $6,842 | $614,700 | $384,600 | $230,100 |
| 2022 | $6,394 | $533,700 | $308,200 | $225,500 |
| 2021 | $6,214 | $511,900 | $308,200 | $203,700 |
| 2020 | $6,045 | $486,300 | $302,200 | $184,100 |
| 2019 | $5,927 | $472,300 | $290,700 | $181,600 |
| 2018 | $5,896 | $442,000 | $277,000 | $165,000 |
| 2017 | $5,610 | $395,900 | $252,000 | $143,900 |
| 2016 | $5,216 | $363,200 | $229,300 | $133,900 |
| 2015 | $4,904 | $335,900 | $208,600 | $127,300 |
| 2014 | $4,877 | $328,200 | $208,600 | $119,600 |
Map
- 67 Colby Rd
- 75 Walker St
- 46 Warwick St
- 185 Quincy Shore Dr Unit U44
- 228 Quincy Shore Dr
- 175 Quincy Shore Dr Unit B33
- 175 Quincy Shore Dr Unit B66
- 175 Quincy Shore Dr Unit B74
- 175 Quincy Shore Dr Unit B23
- 260 Newbury Ave
- 153 Vassall St
- 16 W Squantum St
- 90 Quincy Shore Dr Unit 311
- 90 Quincy Shore Dr Unit 302
- 90 Quincy Shore Dr Unit 108
- 19 Holmes St Unit 1
- 17 Holmes St Unit PH
- 150 Hancock St Unit 101
- 174 Beach St
- 133 Commander Shea Blvd Unit 502
- 59 Appleton St
- 63 Appleton St
- 55 Appleton St
- 51 Appleton St
- 51 Appleton St Unit 1
- 53 Appleton St Unit 2
- 69 Appleton St
- 69 Appleton St Unit 2-2
- 69 Appleton St Unit 3
- 69 Appleton St Unit 2
- 62 Bayfield Rd N
- 49 Appleton St
- 68 Bayfield Rd N
- 60 Bayfield Rd N
- 72 Bayfield Rd N
- 72 Bayfield Rd N Unit 99999999
- 75 Appleton St
- 75 Appleton St Unit 1
- 75 Appleton St Unit 2
- 56 Bayfield Rd N
Ask me questions while you tour the home.