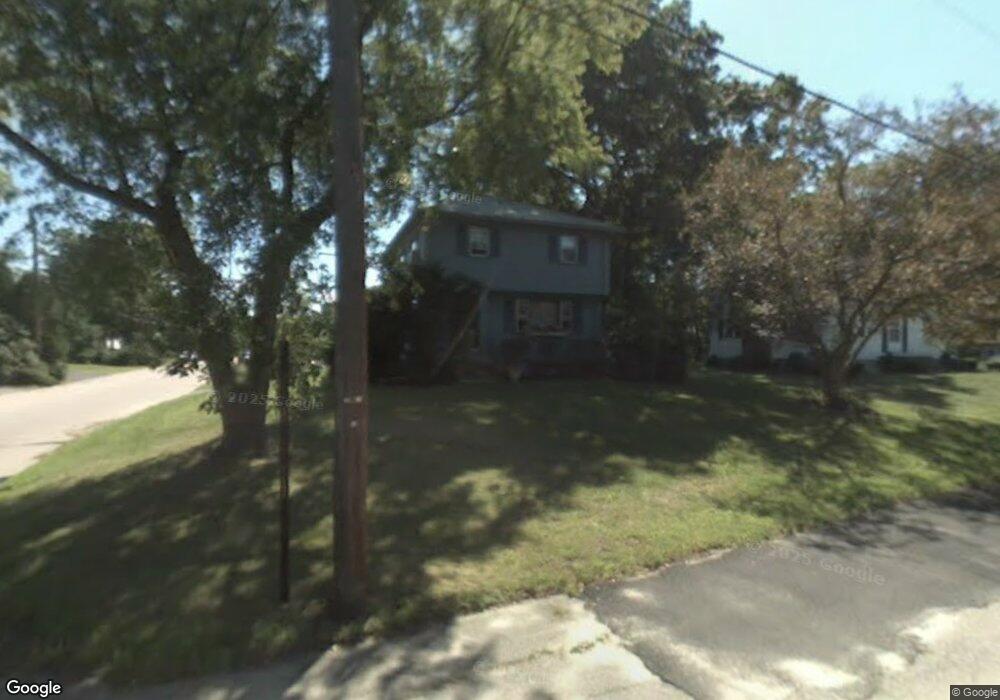
66 Carleton Ave Brockton, MA 02301
Clifton Heights NeighborhoodEstimated Value: $494,000 - $530,000
4
Beds
2
Baths
1,904
Sq Ft
$271/Sq Ft
Est. Value
About This Home
This home is located at 66 Carleton Ave, Brockton, MA 02301 and is currently estimated at $516,646, approximately $271 per square foot. 66 Carleton Ave is a home located in Plymouth County with nearby schools including Gilmore Elementary School, John F. Kennedy Elementary School, and Davis K-8 School.
Ownership History
Date
Name
Owned For
Owner Type
Purchase Details
Closed on
Jun 30, 1997
Sold by
Clifford John H and Kohberger Carla D
Bought by
Power John T and Power Marianne
Current Estimated Value
Home Financials for this Owner
Home Financials are based on the most recent Mortgage that was taken out on this home.
Original Mortgage
$104,400
Interest Rate
7.81%
Mortgage Type
Purchase Money Mortgage
Create a Home Valuation Report for This Property
The Home Valuation Report is an in-depth analysis detailing your home's value as well as a comparison with similar homes in the area
Home Values in the Area
Average Home Value in this Area
Purchase History
We collect this data history from publicly available records. To have your information removed, we recommend requesting removal directly through your county’s website.
| Date | Buyer | Sale Price | Title Company |
|---|---|---|---|
| Power John T | $109,900 | -- |
Source: Public Records
Mortgage History
We collect this data history from publicly available records. To have your information removed, we recommend requesting removal directly through your county’s website.
| Date | Status | Borrower | Loan Amount |
|---|---|---|---|
| Open | Power John T | $120,000 | |
| Closed | Power John T | $102,000 | |
| Closed | Power John T | $115,000 | |
| Closed | Power John T | $104,400 |
Source: Public Records
Tax History
| Year | Tax Paid | Tax Assessment Tax Assessment Total Assessment is a certain percentage of the fair market value that is determined by local assessors to be the total taxable value of land and additions on the property. | Land | Improvement |
|---|---|---|---|---|
| 2025 | $5,205 | $429,800 | $140,000 | $289,800 |
| 2024 | $5,004 | $416,300 | $140,000 | $276,300 |
| 2023 | $5,189 | $399,800 | $104,000 | $295,800 |
| 2022 | $5,162 | $369,500 | $94,600 | $274,900 |
| 2021 | $4,440 | $306,200 | $78,500 | $227,700 |
| 2020 | $4,647 | $306,700 | $73,600 | $233,100 |
| 2019 | $4,625 | $297,600 | $71,800 | $225,800 |
| 2018 | $4,240 | $264,000 | $71,800 | $192,200 |
| 2017 | $4,035 | $250,600 | $71,800 | $178,800 |
| 2016 | $4,180 | $240,800 | $69,600 | $171,200 |
| 2015 | $3,949 | $217,600 | $69,600 | $148,000 |
| 2014 | $3,722 | $205,300 | $69,600 | $135,700 |
Source: Public Records
Map
Nearby Homes
- 197 Market St
- 153 Brookside Ave
- 273 W Chestnut St
- 46 Churchill Ave
- 45 Wyoming Ave
- 35 Chestnut Dr
- 26 South St
- 60 Tremont St
- 9 Carroll Ave
- 35 Longworth Ave Unit 25
- 35 Longworth Ave Unit 12
- 25 Tremont St
- 25 Longworth Ave Unit 8
- 15 Longworth Ave Unit 226
- 9 Longworth Ave Unit 113
- 33 Glendale Ave
- 222 Menlo St
- 96 Sunset Ave
- 112 Laureston St
- 115 Talbot St
- 10 Judith Rd
- 35 Hoover Ave
- 65 Carleton Ave
- 55 Carleton Ave
- 33 Hoover Ave
- 36 Patricia Ln
- 15 Judith Rd
- 44 Patricia Ln
- 26 Patricia Ln
- 41 Carleton Ave Unit 2
- 41 Carleton Ave Unit 1
- 36 Hoover Ave
- 34 Hoover Ave
- 25 Hoover Ave
- 50 Carleton Ave
- 4 Jane Terrace
- 18 Patricia Ln
- 4 Jane Terrace
- 32 Hoover Ave
- 39 Carleton Ave
Your Personal Tour Guide
Ask me questions while you tour the home.