66 Hancock St Stoneham, MA 02180
Haywardville NeighborhoodEstimated Value: $793,000 - $902,000
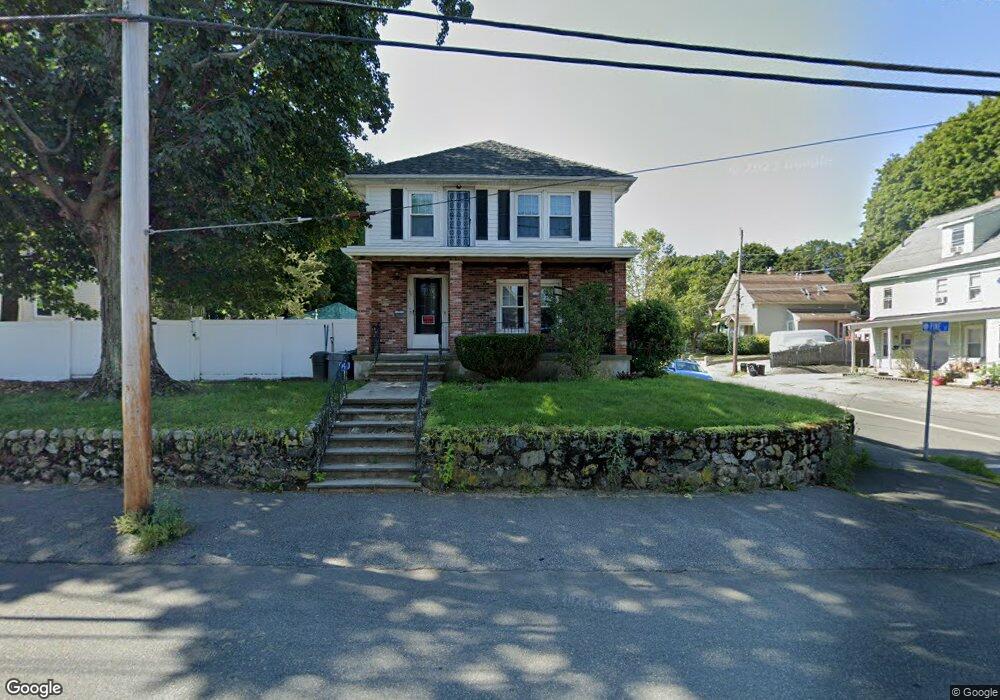
About This Home
This home is located at 66 Hancock St, Stoneham, MA 02180 and is currently estimated at $856,003, approximately $370 per square foot. 66 Hancock St is a home located in Middlesex County with nearby schools including Stoneham High School, St. Patrick Elementary School, and Greater Boston Academy.
Ownership History
We collect this data history from publicly available records. To have your information removed, we recommend requesting removal directly through your county’s website.
Purchase Details
Purchase Details
Home Values in the Area
Average Home Value in this Area
Purchase History
We collect this data history from publicly available records. To have your information removed, we recommend requesting removal directly through your county’s website.
| Date | Buyer | Sale Price | Title Company |
|---|---|---|---|
| -- | -- | ||
| -- | -- |
Tax History
We collect this data history from publicly available records. To have your information removed, we recommend requesting removal directly through your county’s website.
| Year | Tax Paid | Tax Assessment Tax Assessment Total Assessment is a certain percentage of the fair market value that is determined by local assessors to be the total taxable value of land and additions on the property. | Land | Improvement |
|---|---|---|---|---|
| 2025 | $7,951 | $777,200 | $369,500 | $407,700 |
| 2024 | $7,921 | $748,000 | $340,300 | $407,700 |
| 2023 | $7,786 | $701,400 | $311,100 | $390,300 |
| 2022 | $6,908 | $663,600 | $282,000 | $381,600 |
| 2021 | $6,968 | $644,000 | $262,500 | $381,500 |
| 2020 | $6,529 | $605,100 | $251,400 | $353,700 |
| 2019 | $6,181 | $550,900 | $234,700 | $316,200 |
| 2018 | $6,059 | $517,400 | $212,700 | $304,700 |
| 2017 | $5,908 | $476,800 | $200,700 | $276,100 |
| 2016 | $5,644 | $444,400 | $200,700 | $243,700 |
| 2015 | $5,329 | $411,200 | $181,600 | $229,600 |
| 2014 | $4,916 | $364,400 | $152,900 | $211,500 |
Map
- 472 Main St Unit C
- 426 Main St Unit 205
- 12 Benton St Unit 4
- 6 Minot St
- 26 Maple St Unit B
- 40 Wright St
- 50 Marble St
- 7 Pine St
- 20 Murdock Rd
- 99 Park St Unit 101
- 14 Katherine Rd
- 193 Park St
- 28 Washington St
- 159 Franklin St Unit E6
- 94 William St
- 146 Marble St Unit 404
- 597 Main St Unit B6
- 20 Landers Rd
- 12 Thomas Cir
- 6-8 South St Unit 2
Ask me questions while you tour the home.