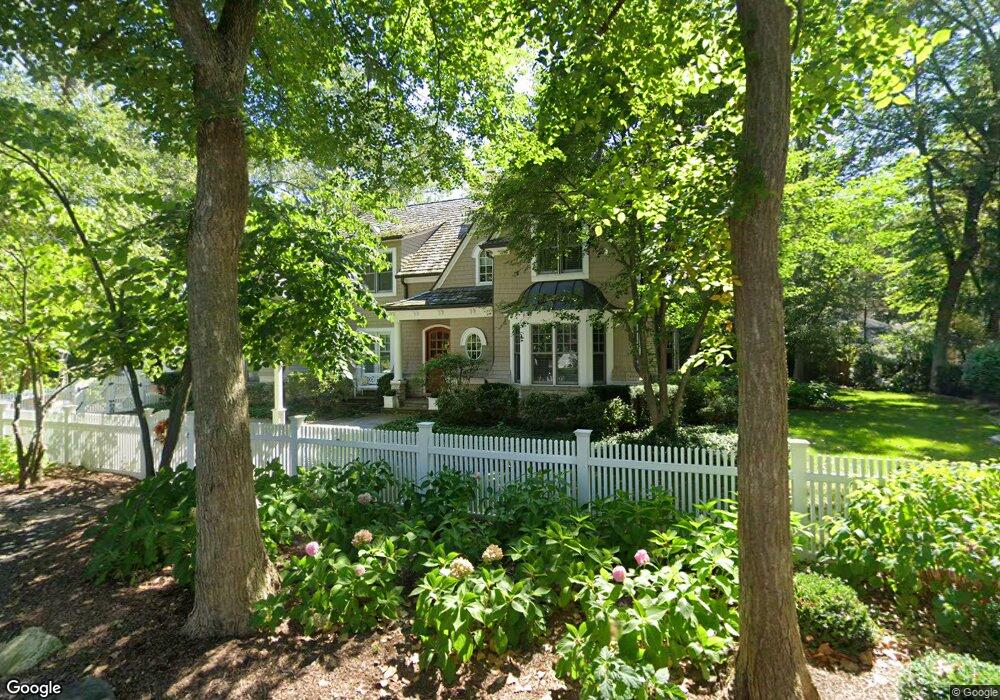
66 Indian Hill Rd Winnetka, IL 60093
Estimated Value: $1,485,000 - $2,578,000
4
Beds
5
Baths
3,608
Sq Ft
$515/Sq Ft
Est. Value
About This Home
This home is located at 66 Indian Hill Rd, Winnetka, IL 60093 and is currently estimated at $1,858,543, approximately $515 per square foot. 66 Indian Hill Rd is a home located in Cook County with nearby schools including Harper Elementary School, Highcrest Middle School, and Wilmette Junior High School.
Ownership History
Date
Name
Owned For
Owner Type
Purchase Details
Closed on
Feb 25, 2005
Sold by
Madison Investment Group Inc
Bought by
Nash Patrick T and Nash Gail C
Current Estimated Value
Purchase Details
Closed on
Mar 20, 2002
Sold by
Chukerman Neal
Bought by
Madison Investment Group Inc
Purchase Details
Closed on
Sep 1, 2000
Sold by
D M D Consultants Inc
Bought by
Chukerman Neal
Purchase Details
Closed on
Jul 10, 2000
Sold by
Blackwell Charles C and Blackwell Helen
Bought by
Dmd Consultants Inc
Purchase Details
Closed on
Jun 1, 1999
Sold by
Blackwell Robert
Bought by
Blackwell Robert B and Robert B Blackwell Trust
Purchase Details
Closed on
Dec 30, 1998
Sold by
The Northern Trust Company
Bought by
Blackwell Charles C and Blackwell Helen
Create a Home Valuation Report for This Property
The Home Valuation Report is an in-depth analysis detailing your home's value as well as a comparison with similar homes in the area
Home Values in the Area
Average Home Value in this Area
Purchase History
| Date | Buyer | Sale Price | Title Company |
|---|---|---|---|
| Nash Patrick T | $2,810,000 | Cti | |
| Madison Investment Group Inc | $827,500 | Chicago Title Insurance Co | |
| Chukerman Neal | -- | -- | |
| Dmd Consultants Inc | $650,000 | -- | |
| Blackwell Robert B | -- | -- | |
| Blackwell Charles C | -- | -- |
Source: Public Records
Tax History
| Year | Tax Paid | Tax Assessment Tax Assessment Total Assessment is a certain percentage of the fair market value that is determined by local assessors to be the total taxable value of land and additions on the property. | Land | Improvement |
|---|---|---|---|---|
| 2025 | $16,989 | $116,738 | $21,120 | $95,618 |
| 2024 | $16,989 | $74,870 | $21,120 | $53,750 |
| 2023 | $16,080 | $74,870 | $21,120 | $53,750 |
| 2022 | $16,080 | $74,870 | $21,120 | $53,750 |
| 2021 | $19,154 | $73,728 | $13,860 | $59,868 |
| 2020 | $18,841 | $73,728 | $13,860 | $59,868 |
| 2019 | $18,457 | $80,908 | $13,860 | $67,048 |
| 2018 | $16,735 | $70,344 | $11,880 | $58,464 |
| 2017 | $16,273 | $70,344 | $11,880 | $58,464 |
| 2016 | $15,290 | $70,344 | $11,880 | $58,464 |
| 2015 | $14,948 | $60,215 | $9,735 | $50,480 |
| 2014 | $14,710 | $60,215 | $9,735 | $50,480 |
| 2013 | $13,742 | $60,215 | $9,735 | $50,480 |
Source: Public Records
Map
Nearby Homes
- 1213 Dartmouth St
- 43 Indian Hill Rd
- 320 Woodley Rd
- 2201 Kenilworth Ave
- 1163 Romona Rd
- 1120 Romona Rd
- 140 Birch St
- 909 Locust Rd
- 2415 Lake Ave
- 2100 Elmwood Ave
- 2836 Blackhawk Rd
- 2025 Thornwood Ave
- 32 Woodley Rd
- 406 Woodley Woods
- 4 Indian Hill Rd
- 1940 Chestnut Ave
- 62 Woodley Rd
- 2938 Indianwood Rd
- 915 Sunset Rd
- 2438 Pomona Ln
- 66 Indian Hill Rd
- 64 Indian Hill Rd
- 2500 Kenilworth Ave
- 2510 Kenilworth Ave
- 61 Indian Hill Rd
- 2514 Kenilworth Ave
- 63 Indian Hill Rd
- 2520 Kenilworth Ave
- 67 Indian Hill Rd
- 59 Indian Hill Rd
- 62 Indian Hill Rd
- 2530 Kenilworth Ave
- 2501 Kenilworth Ave
- 2501 Kenilworth Ave
- 2507 Kenilworth Ave
- 2507 Kenilworth Ave
- 65 Indian Hill Rd
- 65 Indian Hill Rd
- 69 Indian Hill Rd
- 2515 Kenilworth Ave
Your Personal Tour Guide
Ask me questions while you tour the home.