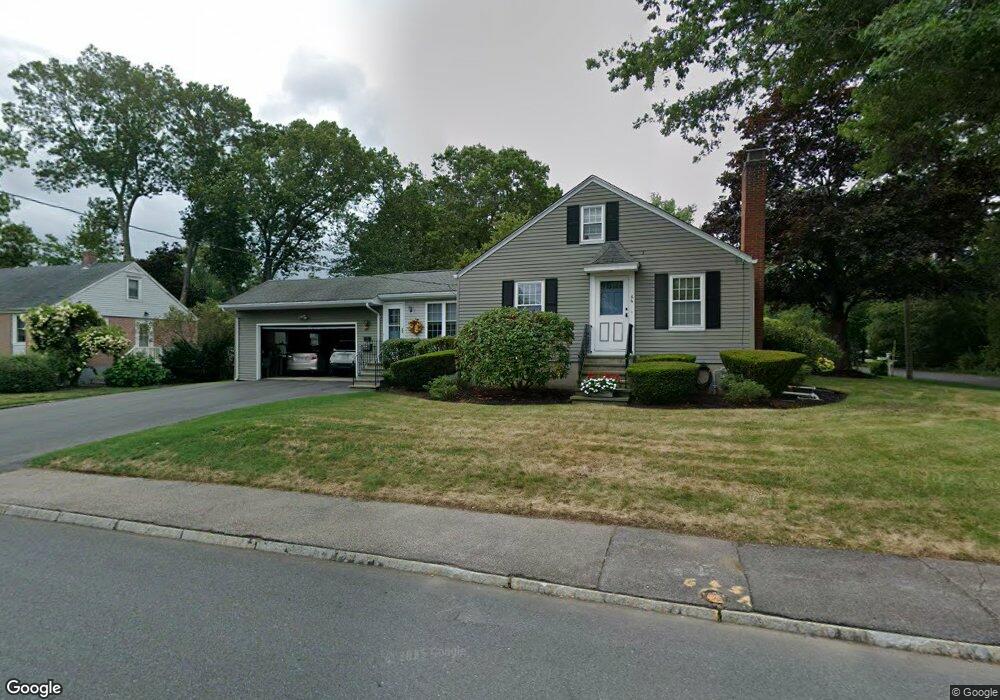
66 Johnson St North Attleboro, MA 02760
Estimated Value: $473,000 - $530,000
3
Beds
2
Baths
1,430
Sq Ft
$352/Sq Ft
Est. Value
About This Home
This home is located at 66 Johnson St, North Attleboro, MA 02760 and is currently estimated at $503,436, approximately $352 per square foot. 66 Johnson St is a home located in Bristol County with nearby schools including North Attleboro High School and Discovery Daycare Center.
Ownership History
Date
Name
Owned For
Owner Type
Purchase Details
Closed on
Jul 27, 1999
Sold by
Coogan Mary P
Bought by
Coogan James W and Coogan Mary E
Current Estimated Value
Home Financials for this Owner
Home Financials are based on the most recent Mortgage that was taken out on this home.
Original Mortgage
$80,000
Outstanding Balance
$22,702
Interest Rate
7.49%
Mortgage Type
Purchase Money Mortgage
Estimated Equity
$480,734
Create a Home Valuation Report for This Property
The Home Valuation Report is an in-depth analysis detailing your home's value as well as a comparison with similar homes in the area
Home Values in the Area
Average Home Value in this Area
Purchase History
We collect this data history from publicly available records. To have your information removed, we recommend requesting removal directly through your county’s website.
| Date | Buyer | Sale Price | Title Company |
|---|---|---|---|
| Coogan James W | $100,000 | -- |
Source: Public Records
Mortgage History
We collect this data history from publicly available records. To have your information removed, we recommend requesting removal directly through your county’s website.
| Date | Status | Borrower | Loan Amount |
|---|---|---|---|
| Open | Coogan James W | $80,000 |
Source: Public Records
Tax History
| Year | Tax Paid | Tax Assessment Tax Assessment Total Assessment is a certain percentage of the fair market value that is determined by local assessors to be the total taxable value of land and additions on the property. | Land | Improvement |
|---|---|---|---|---|
| 2025 | $5,505 | $466,900 | $144,600 | $322,300 |
| 2024 | $5,235 | $453,600 | $144,600 | $309,000 |
| 2023 | $5,157 | $403,200 | $144,600 | $258,600 |
| 2022 | $4,848 | $348,000 | $144,600 | $203,400 |
| 2021 | $4,910 | $344,100 | $144,600 | $199,500 |
| 2020 | $4,794 | $334,100 | $144,600 | $189,500 |
| 2019 | $4,571 | $321,000 | $131,500 | $189,500 |
| 2018 | $4,083 | $306,100 | $131,500 | $174,600 |
| 2017 | $3,805 | $287,800 | $131,500 | $156,300 |
| 2016 | $3,909 | $295,700 | $146,100 | $149,600 |
| 2015 | $3,603 | $274,200 | $146,100 | $128,100 |
| 2014 | $3,348 | $252,900 | $128,200 | $124,700 |
Source: Public Records
Map
Nearby Homes
- 16 Ranch St
- 132 Sumner St
- 157 Westside Ave
- 117 Church St Unit 4
- 8 Hillside Rd
- 77 Church St
- 28 Church St
- 52 High St
- 40 Metcalf Rd
- 562 High St
- 508 High St
- 14 Broad St
- 54 John Grimaldi Dr
- 86 Division St
- 300 E Washington St Unit 10E
- 300 E Washington St Unit 11R
- 139 East St
- 32 Anawan Rd
- 3 Riley Ct
- 186 Elm St
Your Personal Tour Guide
Ask me questions while you tour the home.