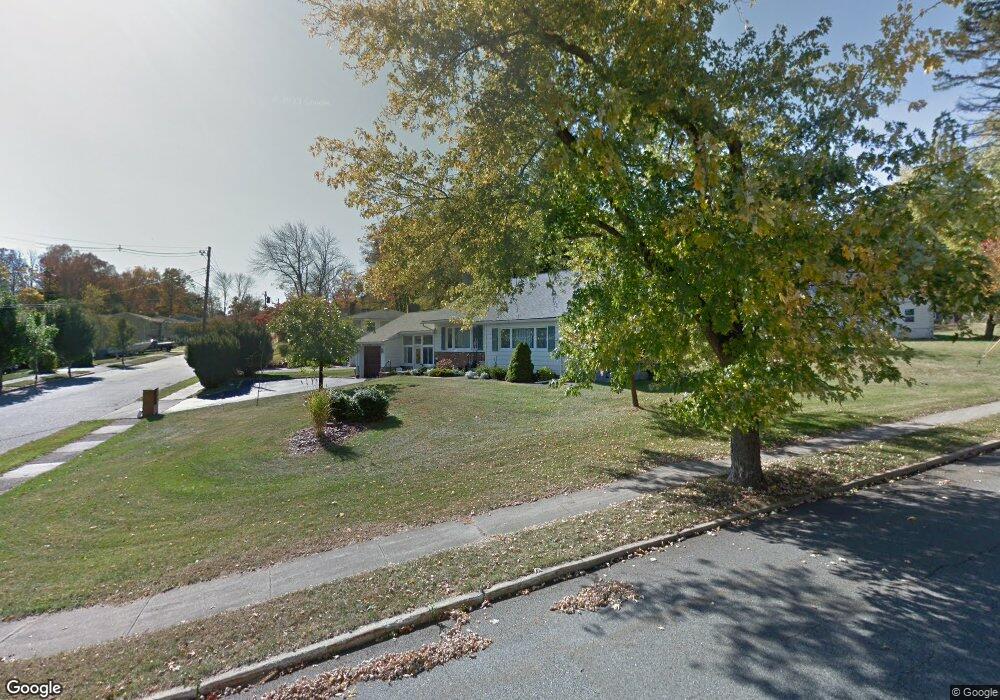
66 Pine St Newton, NJ 07860
Estimated Value: $381,000 - $440,000
Studio
--
Bath
1,612
Sq Ft
$255/Sq Ft
Est. Value
About This Home
This home is located at 66 Pine St, Newton, NJ 07860 and is currently estimated at $411,665, approximately $255 per square foot. 66 Pine St is a home located in Sussex County with nearby schools including Merriam Avenue School, Halsted Street Middle School, and Newton High School.
Ownership History
Date
Name
Owned For
Owner Type
Purchase Details
Closed on
Dec 2, 2011
Sold by
Tienken Valerie and Tienken Henry
Bought by
Tienken Valerie and Tienken Henry
Current Estimated Value
Purchase Details
Closed on
Mar 30, 2001
Sold by
Qarmout Anwar G and Qarmout Suhair
Bought by
Tienken Valerie and Tienken Henry
Purchase Details
Closed on
Jun 10, 1999
Sold by
Qarmout Lewis G and Qarmout Sophia
Bought by
Qarmout Anwar Q
Home Financials for this Owner
Home Financials are based on the most recent Mortgage that was taken out on this home.
Original Mortgage
$98,000
Interest Rate
6.99%
Mortgage Type
Purchase Money Mortgage
Purchase Details
Closed on
Oct 30, 1996
Sold by
Hargas Mamie L
Bought by
Qarmout Lewis G
Home Financials for this Owner
Home Financials are based on the most recent Mortgage that was taken out on this home.
Original Mortgage
$100,000
Interest Rate
8.1%
Create a Home Valuation Report for This Property
The Home Valuation Report is an in-depth analysis detailing your home's value as well as a comparison with similar homes in the area
Home Values in the Area
Average Home Value in this Area
Purchase History
| Date | Buyer | Sale Price | Title Company |
|---|---|---|---|
| Tienken Valerie | -- | None Available | |
| Tienken Valerie | $140,000 | -- | |
| Qarmout Anwar Q | $140,000 | -- | |
| Qarmout Lewis G | $125,000 | First American Title Ins Co |
Source: Public Records
Mortgage History
| Date | Status | Borrower | Loan Amount |
|---|---|---|---|
| Previous Owner | Qarmout Anwar Q | $98,000 | |
| Previous Owner | Qarmout Lewis G | $100,000 |
Source: Public Records
Tax History
| Year | Tax Paid | Tax Assessment Tax Assessment Total Assessment is a certain percentage of the fair market value that is determined by local assessors to be the total taxable value of land and additions on the property. | Land | Improvement |
|---|---|---|---|---|
| 2025 | $9,643 | $380,600 | $116,700 | $263,900 |
| 2024 | $8,957 | $353,600 | $93,900 | $259,700 |
Source: Public Records
Map
Nearby Homes
Your Personal Tour Guide
Ask me questions while you tour the home.