Estimated Value: $276,000 - $297,000
3
Beds
3
Baths
2,469
Sq Ft
$116/Sq Ft
Est. Value
About This Home
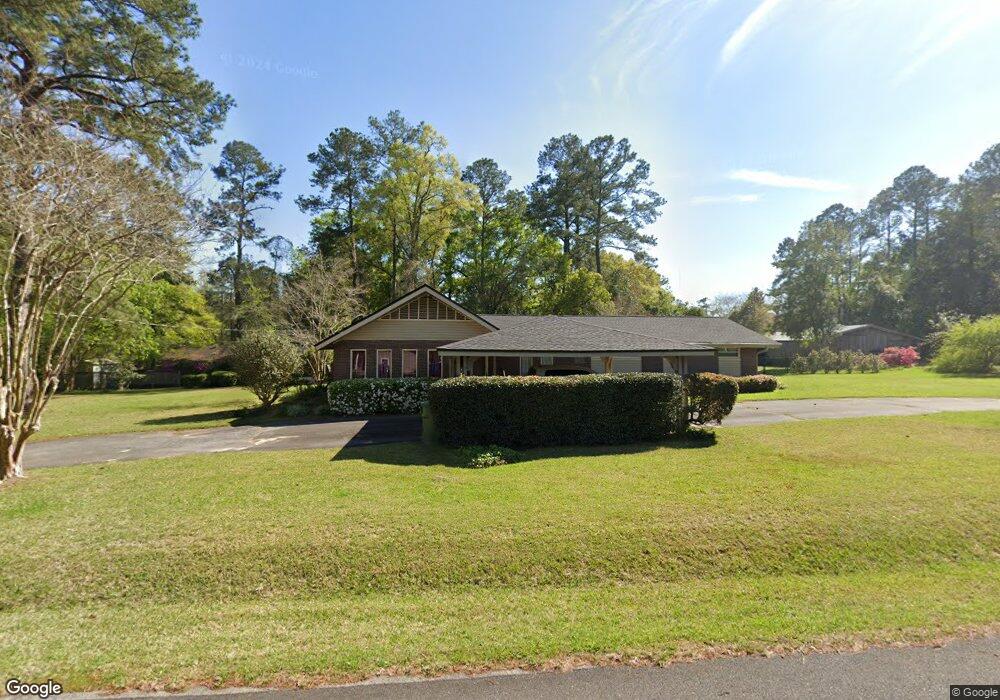
This home is located at 660 9th Ave SE, Cairo, GA 39828 and is currently estimated at $286,831, approximately $116 per square foot. 660 9th Ave SE is a home located in Grady County with nearby schools including Cairo High School.
Ownership History
Date
Name
Owned For
Owner Type
Purchase Details
Closed on
Aug 5, 2011
Sold by
Sumner Frances Collins
Bought by
Ross Jonathan P and Ross Tamella T
Current Estimated Value
Home Financials for this Owner
Home Financials are based on the most recent Mortgage that was taken out on this home.
Original Mortgage
$125,000
Outstanding Balance
$84,882
Interest Rate
4.62%
Mortgage Type
VA
Estimated Equity
$201,949
Purchase Details
Closed on
Jul 14, 1974
Bought by
Sumner Howard L
Create a Home Valuation Report for This Property
The Home Valuation Report is an in-depth analysis detailing your home's value as well as a comparison with similar homes in the area
Purchase History
We collect this data history from publicly available records. To have your information removed, we recommend requesting removal directly through your county’s website.
| Date | Buyer | Sale Price | Title Company |
|---|---|---|---|
| Ross Jonathan P | $62,500 | -- | |
| Ross Jonathan P | $62,500 | -- | |
| Sumner Howard L | -- | -- |
Source: Public Records
Mortgage History
We collect this data history from publicly available records. To have your information removed, we recommend requesting removal directly through your county’s website.
| Date | Status | Borrower | Loan Amount |
|---|---|---|---|
| Open | Ross Jonathan P | $125,000 |
Source: Public Records
Tax History
| Year | Tax Paid | Tax Assessment Tax Assessment Total Assessment is a certain percentage of the fair market value that is determined by local assessors to be the total taxable value of land and additions on the property. | Land | Improvement |
|---|---|---|---|---|
| 2025 | $3,046 | $114,042 | $4,160 | $109,882 |
| 2024 | $3,046 | $102,794 | $4,160 | $98,634 |
| 2023 | $2,195 | $60,975 | $10,514 | $50,461 |
| 2022 | $2,286 | $60,975 | $10,514 | $50,461 |
| 2021 | $2,292 | $60,975 | $10,514 | $50,461 |
| 2020 | $2,298 | $60,975 | $10,514 | $50,461 |
| 2019 | $2,298 | $60,975 | $10,514 | $50,461 |
| 2018 | $2,185 | $58,702 | $10,514 | $48,188 |
| 2017 | $2,022 | $58,702 | $10,514 | $48,188 |
| 2016 | $1,768 | $50,403 | $10,514 | $39,889 |
| 2015 | $1,750 | $50,403 | $10,514 | $39,889 |
| 2014 | $1,751 | $50,403 | $10,514 | $39,889 |
| 2013 | -- | $46,557 | $10,513 | $36,044 |
Source: Public Records
Map
Nearby Homes
- 618 8th Ave SE
- 530 6th Ave SE
- 600 5th St SE
- 139 Joyner Rd
- 481 4th St SE
- 592 20th St SE
- 138 Joyner Rd
- 1406 Platt Ave
- 000 S Broad St
- 1590 Lullwater Cir SE
- 00 Blackberry Ln
- 00 Meridian Rd
- 00 Cuffhead Rd
- 00 Union Hill Rd
- 112 Pine Cir SW
- 711 2nd Ave NE
- 117 SW Pine Cirlce
- 198 Oakdale Rd SE
- 460 2nd St SW
- 220 13th Ave SW
- 685 10th Ave SE
- 644 9th Ave SE
- 675 9th Ave SE
- 665 9th Ave SE
- 673 10th Ave SE
- 647 9th Ave SE
- 685 9th Ave SE
- 647 9th Ave SE
- 690 10th Ave SE
- 634 9th Ave SE
- 700 10th Ave SE
- 689 9th Ave SE
- 664 10th Ave SE
- 650 8th Ave SE
- 646 8th Ave SE
- 656 8th Ave SE
- 635 10th Ave SE
- 620 8th Ave SE
- 662 8th Ave SE
- 631 9th Ave SE
Your Personal Tour Guide
Ask me questions while you tour the home.