Estimated Value: $150,018 - $250,000
2
Beds
1
Bath
840
Sq Ft
$226/Sq Ft
Est. Value
About This Home
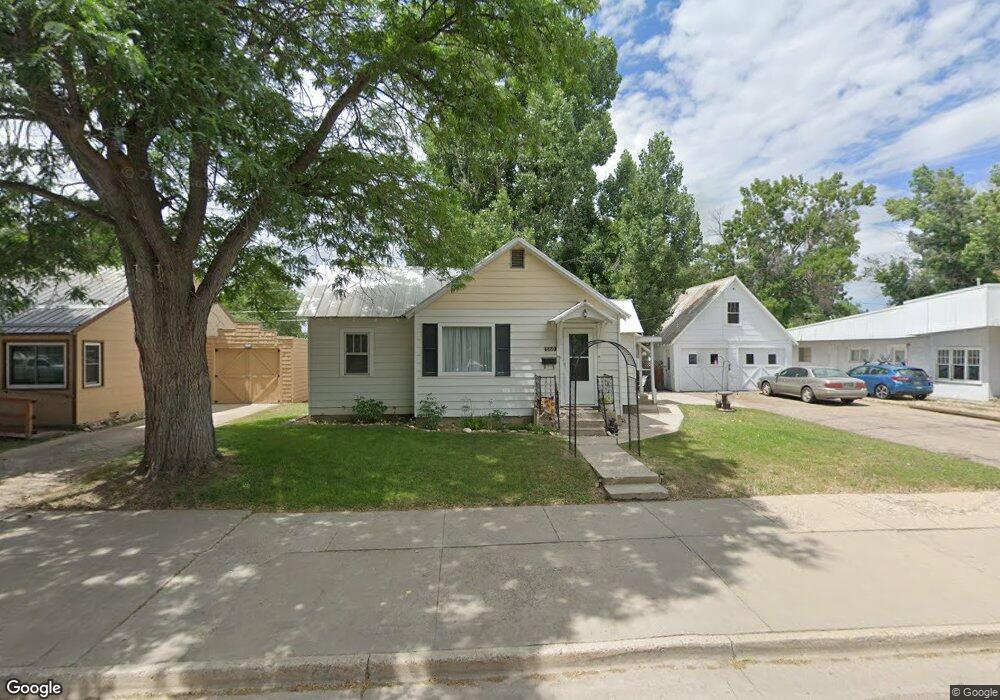
This home is located at 660 Barclay St, Craig, CO 81625 and is currently estimated at $189,505, approximately $225 per square foot. 660 Barclay St is a home located in Moffat County with nearby schools including Sunset Elementary School, Moffat County High School, and Calvary Baptist School.
Ownership History
Date
Name
Owned For
Owner Type
Purchase Details
Closed on
Oct 17, 2011
Sold by
The Bank Of New York Mellon
Bought by
Grandbouche Thad
Current Estimated Value
Purchase Details
Closed on
Jun 30, 2011
Sold by
Schmedeke Frank Thomas and Schmedeke Jana Beth
Bought by
The Bank Of New York Mellon
Purchase Details
Closed on
Nov 24, 2009
Sold by
Schmedeke Frank Thomas and Schmedeke Jana Beth
Bought by
Schmedeke Frank Thomas
Create a Home Valuation Report for This Property
The Home Valuation Report is an in-depth analysis detailing your home's value as well as a comparison with similar homes in the area
Purchase History
We collect this data history from publicly available records. To have your information removed, we recommend requesting removal directly through your county’s website.
| Date | Buyer | Sale Price | Title Company |
|---|---|---|---|
| Grandbouche Thad | $62,050 | Servicelink | |
| The Bank Of New York Mellon | -- | None Available | |
| Schmedeke Frank Thomas | -- | None Available |
Source: Public Records
Tax History
| Year | Tax Paid | Tax Assessment Tax Assessment Total Assessment is a certain percentage of the fair market value that is determined by local assessors to be the total taxable value of land and additions on the property. | Land | Improvement |
|---|---|---|---|---|
| 2025 | $848 | $9,235 | $0 | $0 |
| 2024 | $848 | $4,790 | $0 | $0 |
| 2023 | $416 | $4,790 | $1,010 | $3,780 |
| 2022 | $556 | $6,590 | $1,860 | $4,730 |
| 2021 | $560 | $6,770 | $1,910 | $4,860 |
| 2020 | $503 | $6,150 | $1,910 | $4,240 |
| 2019 | $498 | $6,150 | $1,910 | $4,240 |
| 2018 | $439 | $5,400 | $1,920 | $3,480 |
| 2017 | $453 | $5,400 | $1,920 | $3,480 |
| 2016 | $489 | $6,020 | $2,130 | $3,890 |
| 2015 | $515 | $6,020 | $2,130 | $3,890 |
| 2013 | $515 | $6,250 | $2,130 | $4,120 |
Source: Public Records
Map
Nearby Homes
Your Personal Tour Guide
Ask me questions while you tour the home.