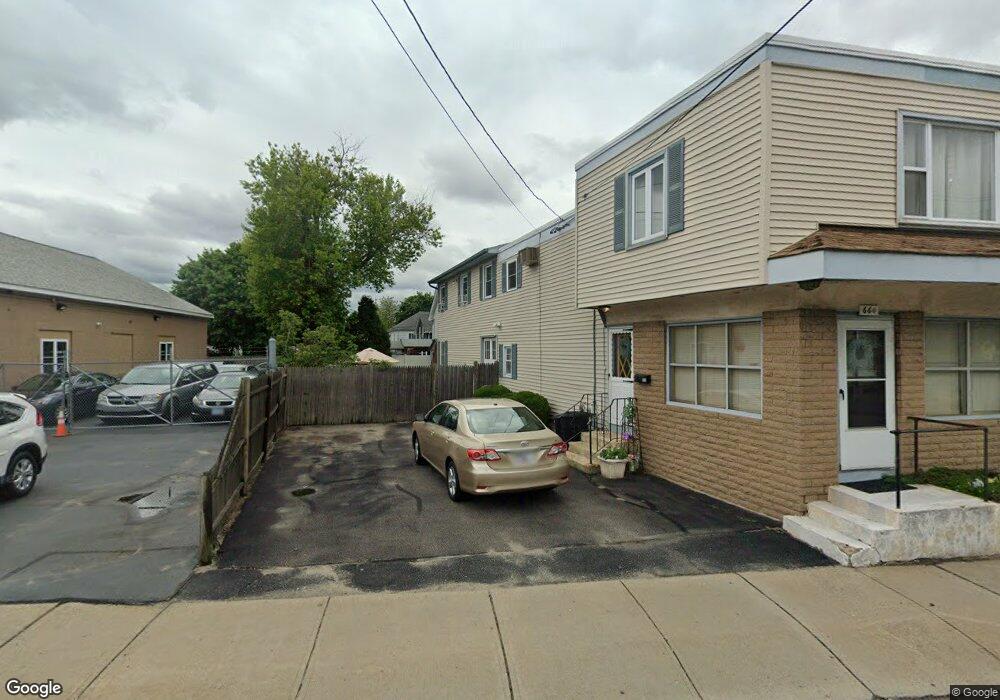
660 Killingly St Johnston, RI 02919
Hartford Avenue NeighborhoodAbout This Home
This home is located at 660 Killingly St, Johnston, RI 02919. 660 Killingly St is a home located in Providence County with nearby schools including Johnston Senior High School, Achievement First Providence Mayoral Academy Elementary, and Mount Pleasant Academy.
Ownership History
We collect this data history from publicly available records. To have your information removed, we recommend requesting removal directly through your county’s website.
Purchase Details
Purchase Details
Purchase Details
Home Values in the Area
Average Home Value in this Area
Purchase History
We collect this data history from publicly available records. To have your information removed, we recommend requesting removal directly through your county’s website.
| Date | Buyer | Sale Price | Title Company |
|---|---|---|---|
| -- | -- | ||
| -- | None Available | ||
| -- | -- |
Tax History
We collect this data history from publicly available records. To have your information removed, we recommend requesting removal directly through your county’s website.
| Year | Tax Paid | Tax Assessment Tax Assessment Total Assessment is a certain percentage of the fair market value that is determined by local assessors to be the total taxable value of land and additions on the property. | Land | Improvement |
|---|---|---|---|---|
| 2025 | $4,161 | $266,400 | $111,900 | $154,500 |
| 2024 | $6,361 | $266,400 | $111,900 | $154,500 |
| 2023 | $6,361 | $266,400 | $111,900 | $154,500 |
| 2022 | $6,361 | $244,800 | $101,600 | $143,200 |
| 2021 | $0 | $244,800 | $101,600 | $143,200 |
| 2018 | $6,361 | $231,400 | $96,700 | $134,700 |
| 2016 | $8,416 | $231,400 | $96,700 | $134,700 |
| 2015 | $6,555 | $226,100 | $96,700 | $129,400 |
| 2014 | $6,500 | $226,100 | $96,700 | $129,400 |
| 2013 | $6,500 | $226,100 | $96,700 | $129,400 |
Map
- 15 Hunter Ave
- 37 King St
- 620 Killingly St
- 2 Fairmount Ave
- 78 Cedar St
- 28 Dante Ave
- 97 Victor Ave
- 12 Arcadia Ave
- 18 Pleasant View Ave
- 18 Jackson Ave Unit 20
- 41 Becker Ave
- 95 Waterman Ave
- 4 Rosemont Ave
- 17 Ostend St
- 50 Rosemont Ave
- 105 Borden Ave
- 42 Vandieman Ave
- 24 Bel Air Dr
- 0 Woodbine St
- 0 Hedley Ave
Ask me questions while you tour the home.