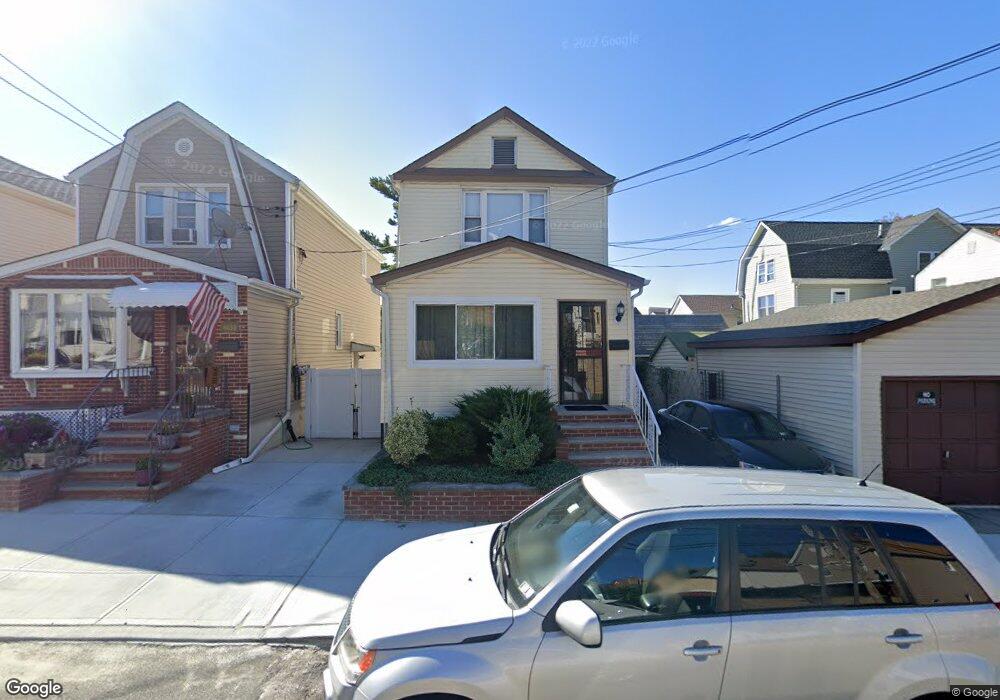
6612 53rd Dr Maspeth, NY 11378
Maspeth NeighborhoodEstimated Value: $1,075,944 - $1,480,000
About This Home
This home is located at 6612 53rd Dr, Maspeth, NY 11378 and is currently estimated at $1,279,736, approximately $446 per square foot. 6612 53rd Dr is a home located in Queens County with nearby schools including P.S. 229 Emanuel Kaplan, IS 73 - The Frank Sansivieri School, and Grover Cleveland High School.
Ownership History
We collect this data history from publicly available records. To have your information removed, we recommend requesting removal directly through your county’s website.
Purchase Details
Purchase Details
Home Values in the Area
Average Home Value in this Area
Purchase History
We collect this data history from publicly available records. To have your information removed, we recommend requesting removal directly through your county’s website.
| Date | Buyer | Sale Price | Title Company |
|---|---|---|---|
| -- | -- | ||
| -- | -- |
Mortgage History
We collect this data history from publicly available records. To have your information removed, we recommend requesting removal directly through your county’s website.
| Date | Status | Borrower | Loan Amount |
|---|---|---|---|
| Open | $150,000 | ||
| Open | $438,000 | ||
| Closed | $200,000 |
Tax History
We collect this data history from publicly available records. To have your information removed, we recommend requesting removal directly through your county’s website.
| Year | Tax Paid | Tax Assessment Tax Assessment Total Assessment is a certain percentage of the fair market value that is determined by local assessors to be the total taxable value of land and additions on the property. | Land | Improvement |
|---|---|---|---|---|
| 2026 | $8,979 | $44,717 | $5,712 | $39,005 |
| 2025 | $8,521 | $44,704 | $6,758 | $37,946 |
| 2024 | $8,521 | $42,425 | $6,339 | $36,086 |
| 2023 | $8,176 | $40,705 | $6,087 | $34,618 |
| 2022 | $7,783 | $64,200 | $11,520 | $52,680 |
| 2021 | $7,842 | $66,840 | $11,520 | $55,320 |
| 2020 | $7,885 | $69,420 | $11,520 | $57,900 |
| 2019 | $7,396 | $66,120 | $11,520 | $54,600 |
| 2018 | $6,915 | $33,921 | $6,366 | $27,555 |
| 2017 | $6,623 | $32,488 | $7,228 | $25,260 |
| 2016 | $6,208 | $32,488 | $7,228 | $25,260 |
| 2015 | $3,697 | $31,044 | $8,510 | $22,534 |
| 2014 | $3,697 | $29,462 | $9,508 | $19,954 |
Map
- 53-50 66th St
- 6637A Jay Ave
- 53-38 66th St
- 53-36 66th St
- 53-24 66th St
- 67-16 53rd Rd
- 5307 65th Place
- 53-74 69th St
- 63-44 53rd Dr
- 65-22 Jay Ave
- 5351 63rd St
- 52-62 68th St
- 65-34 Jay Ave
- 5263 65th Place
- 52-54 65th Place Unit 1P
- 6619 Clinton Ave
- 66-17 Clinton Ave
- 5337 62nd St
- 5301 62nd St
- 62-19 53rd Ave Unit 6J
Ask me questions while you tour the home.