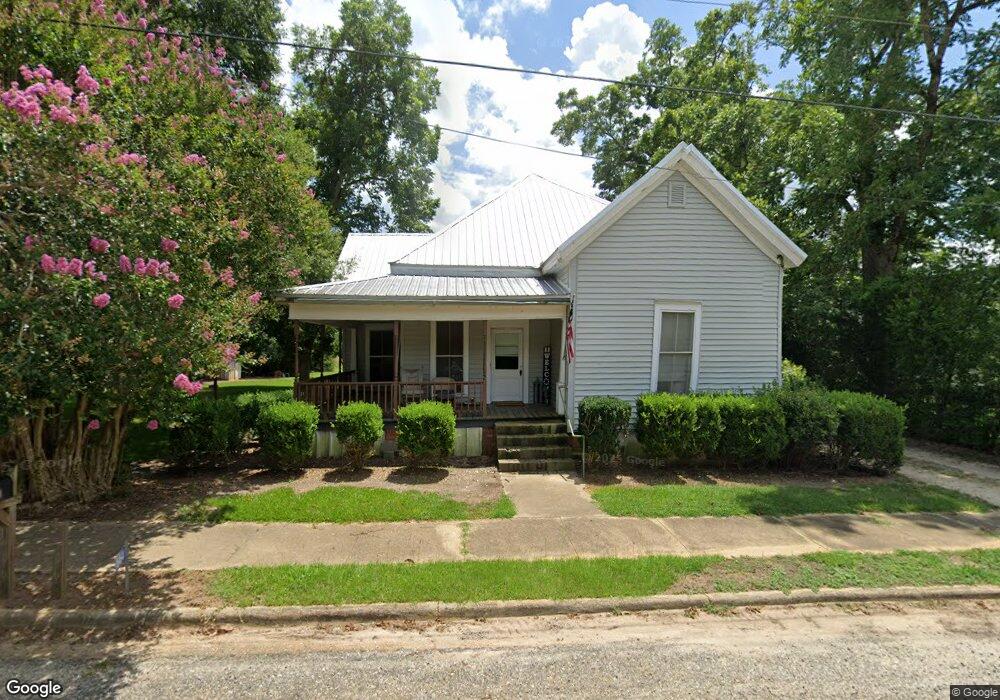
664 Carnegie Rd Coleman, GA 39836
Estimated Value: $87,000 - $284,000
3
Beds
2
Baths
1,656
Sq Ft
$95/Sq Ft
Est. Value
About This Home
This home is located at 664 Carnegie Rd, Coleman, GA 39836 and is currently estimated at $157,402, approximately $95 per square foot. 664 Carnegie Rd is a home located in Randolph County with nearby schools including Randolph County Elementary School, Randolph Clay Middle School, and Randolph Clay High School.
Ownership History
Date
Name
Owned For
Owner Type
Purchase Details
Closed on
Jul 25, 2015
Sold by
Andrews James Robert
Bought by
Andrews James Robert Estate
Current Estimated Value
Purchase Details
Closed on
Dec 30, 2011
Sold by
Us Bank National Association
Bought by
Andrews Robert and Nichols Julian
Purchase Details
Closed on
Aug 15, 2011
Sold by
Fulford Virgie
Bought by
Us Bank National Association
Purchase Details
Closed on
Feb 15, 2007
Sold by
Bantz Ricky A
Bought by
Fulford Virgie
Home Financials for this Owner
Home Financials are based on the most recent Mortgage that was taken out on this home.
Original Mortgage
$67,200
Interest Rate
6.16%
Mortgage Type
New Conventional
Purchase Details
Closed on
Nov 2, 1998
Sold by
Gresham Brenda Gail
Bought by
Bantz Ricky A
Purchase Details
Closed on
Jun 20, 1997
Sold by
Lindsey Eva Inez F
Bought by
Gresham Brenda Gail
Purchase Details
Closed on
Jul 25, 1995
Bought by
Lindsey Eva Inez F
Create a Home Valuation Report for This Property
The Home Valuation Report is an in-depth analysis detailing your home's value as well as a comparison with similar homes in the area
Home Values in the Area
Average Home Value in this Area
Purchase History
We collect this data history from publicly available records. To have your information removed, we recommend requesting removal directly through your county’s website.
| Date | Buyer | Sale Price | Title Company |
|---|---|---|---|
| Andrews James Robert Estate | -- | -- | |
| Andrews Robert | $22,000 | -- | |
| Andrews Robert | $22,000 | -- | |
| Us Bank National Association | -- | -- | |
| Us Bank National Association | -- | -- | |
| Fulford Virgie | $84,000 | -- | |
| Fulford Virgie | $84,000 | -- | |
| Bantz Ricky A | $27,000 | -- | |
| Bantz Ricky A | $27,000 | -- | |
| Gresham Brenda Gail | -- | -- | |
| Gresham Brenda Gail | -- | -- | |
| Lindsey Eva Inez F | -- | -- | |
| Lindsey Eva Inez F | -- | -- |
Source: Public Records
Mortgage History
We collect this data history from publicly available records. To have your information removed, we recommend requesting removal directly through your county’s website.
| Date | Status | Borrower | Loan Amount |
|---|---|---|---|
| Previous Owner | Fulford Virgie | $67,200 |
Source: Public Records
Tax History
| Year | Tax Paid | Tax Assessment Tax Assessment Total Assessment is a certain percentage of the fair market value that is determined by local assessors to be the total taxable value of land and additions on the property. | Land | Improvement |
|---|---|---|---|---|
| 2025 | $1,377 | $33,160 | $1,240 | $31,920 |
| 2024 | $1,274 | $29,840 | $1,120 | $28,720 |
| 2023 | $1,124 | $29,840 | $1,120 | $28,720 |
| 2022 | $1,056 | $29,840 | $1,120 | $28,720 |
| 2021 | $639 | $17,774 | $1,142 | $16,632 |
| 2020 | $657 | $17,774 | $1,142 | $16,632 |
| 2019 | $655 | $17,774 | $1,142 | $16,632 |
| 2018 | $627 | $17,774 | $1,142 | $16,632 |
| 2017 | $630 | $17,774 | $1,142 | $16,632 |
| 2016 | $632 | $17,774 | $1,142 | $16,632 |
| 2015 | -- | $17,774 | $1,142 | $16,632 |
| 2014 | -- | $17,423 | $1,142 | $16,281 |
| 2013 | -- | $17,423 | $1,142 | $16,281 |
Source: Public Records
Map
Nearby Homes
- 24346 U S 27
- 24333 U S 27
- 705 Ferguson Creek Rd
- 203 Wayback Rd
- 1 Pine St
- 0 Pine St
- 1626 Pine St
- 229 +-ac Cty Rd 62 Cty Rd 160 (Morgan Rd)
- 19750 Hartford St
- Pine St NW
- 19468 Hartford St E
- 0 Davis Chapel Rd
- 0077 George Milling Rd
- 04 George Milling Rd
- 012 George Milling Rd
- 008 George Milling Rd
- 014 George Milling Rd
- 013 George Milling Rd
- 298 Nelson Coffin Dr
- 0 District Line Rd Unit 10518137
- 660 Carnegie Rd
- 670 Carnegie Rd
- 673 Carnegie Rd
- 681 Carnegie Rd
- 684 Carnegie Rd
- 463 Georgia 216
- 666 Ga Highway 216
- 79 Depot Rd
- 29 Eleven Bridges Rd
- 36 Eleven Bridges Rd
- 97 Depot Rd
- 216 Ga
- 633 Ga Highway 216
- 9 Mckinnon St
- 426 Ga Highway 216
- 426 Ga Highway 216
- 22 Mckinnon St
- 87 Depot Rd
- 8 Mckinnon St
- 0 Mckinnon St
Your Personal Tour Guide
Ask me questions while you tour the home.