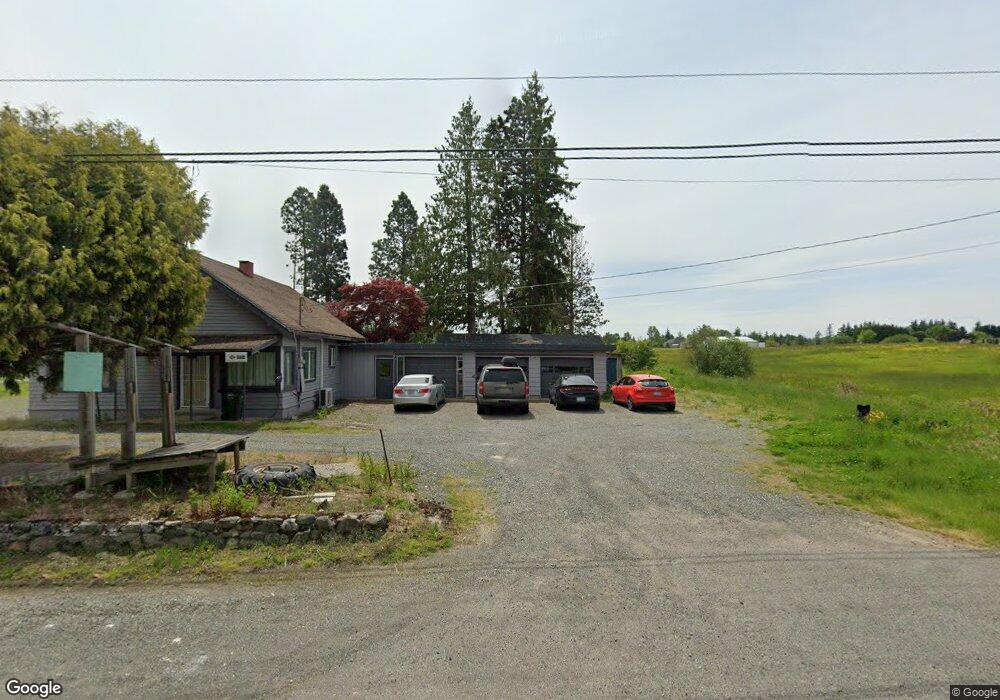
667 E Smith Rd Bellingham, WA 98226
Estimated Value: $575,000 - $976,168
3
Beds
1
Bath
1,368
Sq Ft
$576/Sq Ft
Est. Value
About This Home
This home is located at 667 E Smith Rd, Bellingham, WA 98226 and is currently estimated at $788,542, approximately $576 per square foot. 667 E Smith Rd is a home located in Whatcom County with nearby schools including Irene Reither Elementary School, Meridian Middle School, and Meridian High School.
Create a Home Valuation Report for This Property
The Home Valuation Report is an in-depth analysis detailing your home's value as well as a comparison with similar homes in the area
Tax History
We collect this data history from publicly available records. To have your information removed, we recommend requesting removal directly through your county’s website.
| Year | Tax Paid | Tax Assessment Tax Assessment Total Assessment is a certain percentage of the fair market value that is determined by local assessors to be the total taxable value of land and additions on the property. | Land | Improvement |
|---|---|---|---|---|
| 2025 | $5,122 | $932,638 | $377,962 | $554,676 |
| 2024 | $7,284 | $907,911 | $353,235 | $554,676 |
| 2023 | $7,284 | $897,502 | $364,160 | $533,342 |
| 2022 | $3,165 | $843,692 | $277,544 | $566,148 |
| 2021 | $3,055 | $316,514 | $220,273 | $96,241 |
| 2020 | $2,687 | $280,098 | $194,930 | $85,168 |
| 2019 | $2,196 | $246,784 | $171,745 | $75,039 |
| 2018 | $2,563 | $221,833 | $154,381 | $67,452 |
| 2017 | $1,429 | $196,312 | $136,620 | $59,692 |
| 2016 | $583 | $191,845 | $127,085 | $64,760 |
| 2015 | $586 | $188,309 | $124,743 | $63,566 |
| 2014 | -- | $183,144 | $121,321 | $61,823 |
| 2013 | -- | $176,832 | $117,140 | $59,692 |
Source: Public Records
Map
Nearby Homes
- 551 E Smith Rd
- 504 E Smith Rd
- 858 E Smith Rd
- 399 E Smith Rd
- 5144 Hannegan Rd
- 725 Denali Ct
- 739 Denali Ct
- 731 Denali Ct
- 5700 Denali Ln
- 720 Denali Ct
- 740 Denali Ct
- 5707 Denali Ln
- 5750 Denali Ln
- 4935 E 3rd Dr
- 5774 Denali Ln
- 353 E Silverado Ct
- 351 W Silverado Ct
- 5140 Guide Meridian
- 4921 Zander Dr
- 186 W Smith Rd
- 680 E Smith Rd
- 656 E Smith Rd
- 646 E Smith Rd
- 699 E Smith Rd
- 633 E Smith Rd
- 709 E Smith Rd
- 710 E Smith Rd
- 628 E Smith Rd
- 0 Gracewood Ln Unit 1095833
- 621 E Smith Rd
- 731 E Smith Rd
- 723 E Smith Rd
- 607 E Smith Rd
- 730 E Smith Rd
- 672 E Smith Rd
- 608 E Smith Rd
- 664 E Smith Rd
- 585 E Smith Rd
- 623 E Smith Rd
- 753 E Smith Rd
Your Personal Tour Guide
Ask me questions while you tour the home.