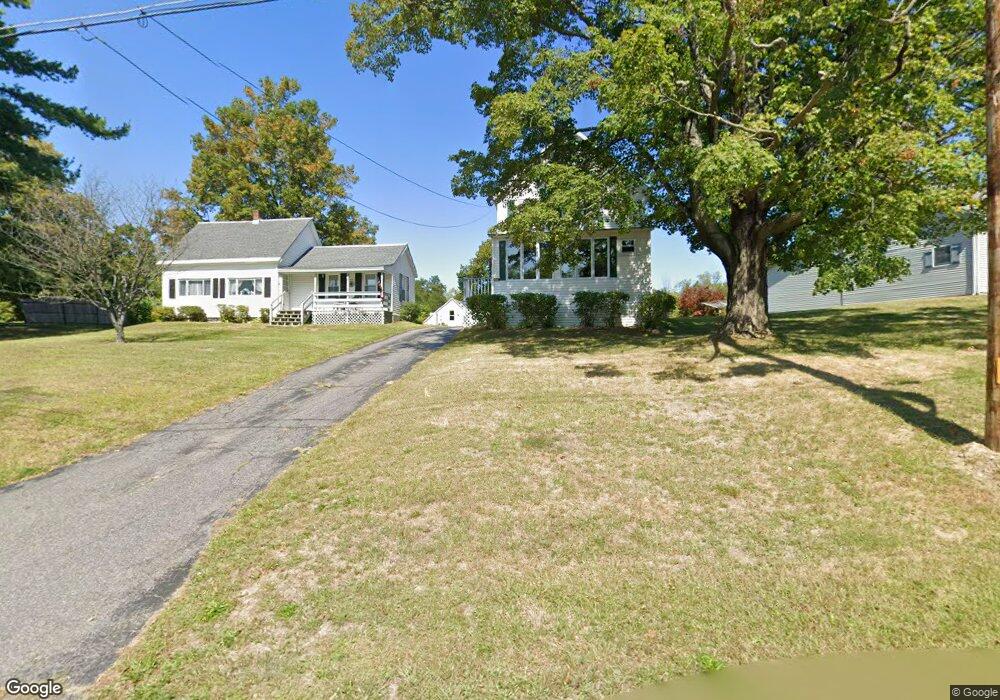
669 E Main St North Adams, MA 01247
Estimated Value: $262,000 - $598,000
3
Beds
2
Baths
1,499
Sq Ft
$243/Sq Ft
Est. Value
About This Home
This home is located at 669 E Main St, North Adams, MA 01247 and is currently estimated at $363,763, approximately $242 per square foot. 669 E Main St is a home located in Berkshire County with nearby schools including Colegrove Park Elementary School and Drury High School.
Ownership History
Date
Name
Owned For
Owner Type
Purchase Details
Closed on
Sep 7, 2017
Sold by
Gaspardi Elaine
Bought by
Bissaillon Kimberly
Current Estimated Value
Home Financials for this Owner
Home Financials are based on the most recent Mortgage that was taken out on this home.
Original Mortgage
$180,000
Outstanding Balance
$148,740
Interest Rate
4.13%
Mortgage Type
New Conventional
Estimated Equity
$215,023
Purchase Details
Closed on
Aug 16, 1968
Bought by
Gaspardi Enrico F and Gaspardi Elaine E
Create a Home Valuation Report for This Property
The Home Valuation Report is an in-depth analysis detailing your home's value as well as a comparison with similar homes in the area
Home Values in the Area
Average Home Value in this Area
Purchase History
We collect this data history from publicly available records. To have your information removed, we recommend requesting removal directly through your county’s website.
| Date | Buyer | Sale Price | Title Company |
|---|---|---|---|
| Bissaillon Kimberly | $120,000 | -- | |
| Gaspardi Enrico F | -- | -- |
Source: Public Records
Mortgage History
We collect this data history from publicly available records. To have your information removed, we recommend requesting removal directly through your county’s website.
| Date | Status | Borrower | Loan Amount |
|---|---|---|---|
| Open | Bissaillon Kimberly | $180,000 |
Source: Public Records
Tax History
| Year | Tax Paid | Tax Assessment Tax Assessment Total Assessment is a certain percentage of the fair market value that is determined by local assessors to be the total taxable value of land and additions on the property. | Land | Improvement |
|---|---|---|---|---|
| 2025 | $3,494 | $209,100 | $29,900 | $179,200 |
| 2024 | $3,281 | $191,400 | $27,400 | $164,000 |
| 2023 | $3,184 | $180,200 | $27,400 | $152,800 |
| 2022 | $2,867 | $154,700 | $27,400 | $127,300 |
| 2021 | $2,669 | $143,400 | $25,400 | $118,000 |
| 2020 | $2,536 | $136,200 | $25,200 | $111,000 |
| 2019 | $2,431 | $127,200 | $25,200 | $102,000 |
| 2018 | $2,334 | $127,000 | $26,600 | $100,400 |
| 2017 | $2,219 | $125,600 | $26,300 | $99,300 |
| 2016 | $2,149 | $123,600 | $26,300 | $97,300 |
| 2015 | $2,068 | $123,900 | $27,200 | $96,700 |
Source: Public Records
Map
Nearby Homes
- 62 Walker St
- 0 Mohawk Trail
- 124 Walker St
- 757 E Main St
- 23 Murray Ave
- 0 Beaver St
- 263 Walker St
- 306 Union St
- 798 Mohawk Trail
- 135 E Quincy St
- 54 Pinehill Terrace
- 100 Autumn Dr
- 0 Oak Hill Unit 237953
- 82 Cherry St
- 77 Natural Bridge Rd
- 360 Mohawk Trail
- 350 Mohawk Trail
- 81 Elmwood Ave
- 130 Franklin St
- 168 Prospect St
Your Personal Tour Guide
Ask me questions while you tour the home.