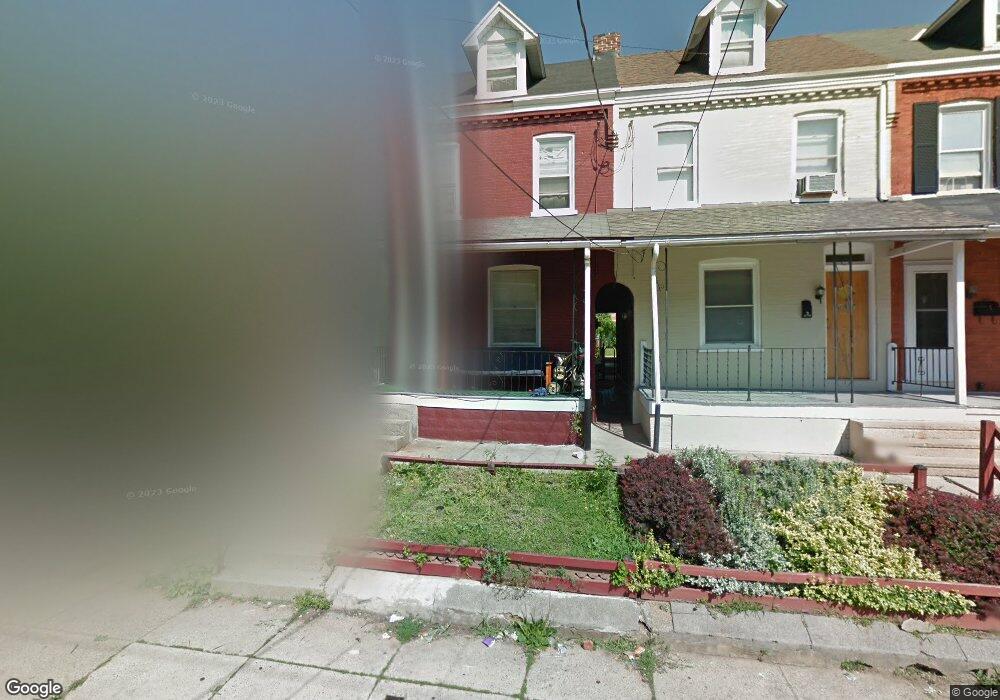
669 Hebrank St Lancaster, PA 17603
Cabbage Hill NeighborhoodEstimated Value: $167,000 - $197,000
3
Beds
1
Bath
1,164
Sq Ft
$153/Sq Ft
Est. Value
About This Home
This home is located at 669 Hebrank St, Lancaster, PA 17603 and is currently estimated at $177,959, approximately $152 per square foot. 669 Hebrank St is a home located in Lancaster County with nearby schools including Price Elementary School, Jackson Middle School, and McCaskey High School.
Ownership History
Date
Name
Owned For
Owner Type
Purchase Details
Closed on
May 7, 2010
Sold by
Duran Eva
Bought by
Figueroa Maryann
Current Estimated Value
Home Financials for this Owner
Home Financials are based on the most recent Mortgage that was taken out on this home.
Original Mortgage
$68,732
Outstanding Balance
$44,943
Interest Rate
4.87%
Mortgage Type
FHA
Estimated Equity
$133,016
Purchase Details
Closed on
Apr 12, 2001
Sold by
Weaver Margaret C
Bought by
Cavanaugh Barbara M
Create a Home Valuation Report for This Property
The Home Valuation Report is an in-depth analysis detailing your home's value as well as a comparison with similar homes in the area
Home Values in the Area
Average Home Value in this Area
Purchase History
| Date | Buyer | Sale Price | Title Company |
|---|---|---|---|
| Figueroa Maryann | $70,000 | Conestoga Title Insurance Co | |
| Cavanaugh Barbara M | $22,000 | -- |
Source: Public Records
Mortgage History
| Date | Status | Borrower | Loan Amount |
|---|---|---|---|
| Open | Figueroa Maryann | $68,732 |
Source: Public Records
Tax History
| Year | Tax Paid | Tax Assessment Tax Assessment Total Assessment is a certain percentage of the fair market value that is determined by local assessors to be the total taxable value of land and additions on the property. | Land | Improvement |
|---|---|---|---|---|
| 2025 | $2,248 | $56,800 | $15,000 | $41,800 |
| 2024 | $2,248 | $56,800 | $15,000 | $41,800 |
| 2023 | $2,210 | $56,800 | $15,000 | $41,800 |
| 2022 | $2,118 | $56,800 | $15,000 | $41,800 |
| 2021 | $2,072 | $56,800 | $15,000 | $41,800 |
| 2020 | $2,072 | $56,800 | $15,000 | $41,800 |
| 2019 | $2,041 | $56,800 | $15,000 | $41,800 |
| 2018 | $774 | $56,800 | $15,000 | $41,800 |
| 2017 | $2,591 | $56,400 | $15,200 | $41,200 |
| 2016 | $2,567 | $56,400 | $15,200 | $41,200 |
| 2015 | $1,001 | $56,400 | $15,200 | $41,200 |
| 2014 | $1,813 | $56,400 | $15,200 | $41,200 |
Source: Public Records
Map
Nearby Homes
- 327 Hazel St
- 624 Poplar St
- 546 Poplar St
- 138 Laurel St
- 529 Poplar St
- 134 Laurel St
- 813 Fremont St
- 841 Wabank St
- 638 High St
- 408 Prospect St
- 517 Saint Joseph St
- 348 S Prince St
- 504 S Prince St
- 448 Fremont St
- 642 Lafayette St
- 517 S Prince St
- 614 Lafayette St
- 614 1/2 Lafayette St
- 643 Fairview Ave
- 751 High St
Your Personal Tour Guide
Ask me questions while you tour the home.